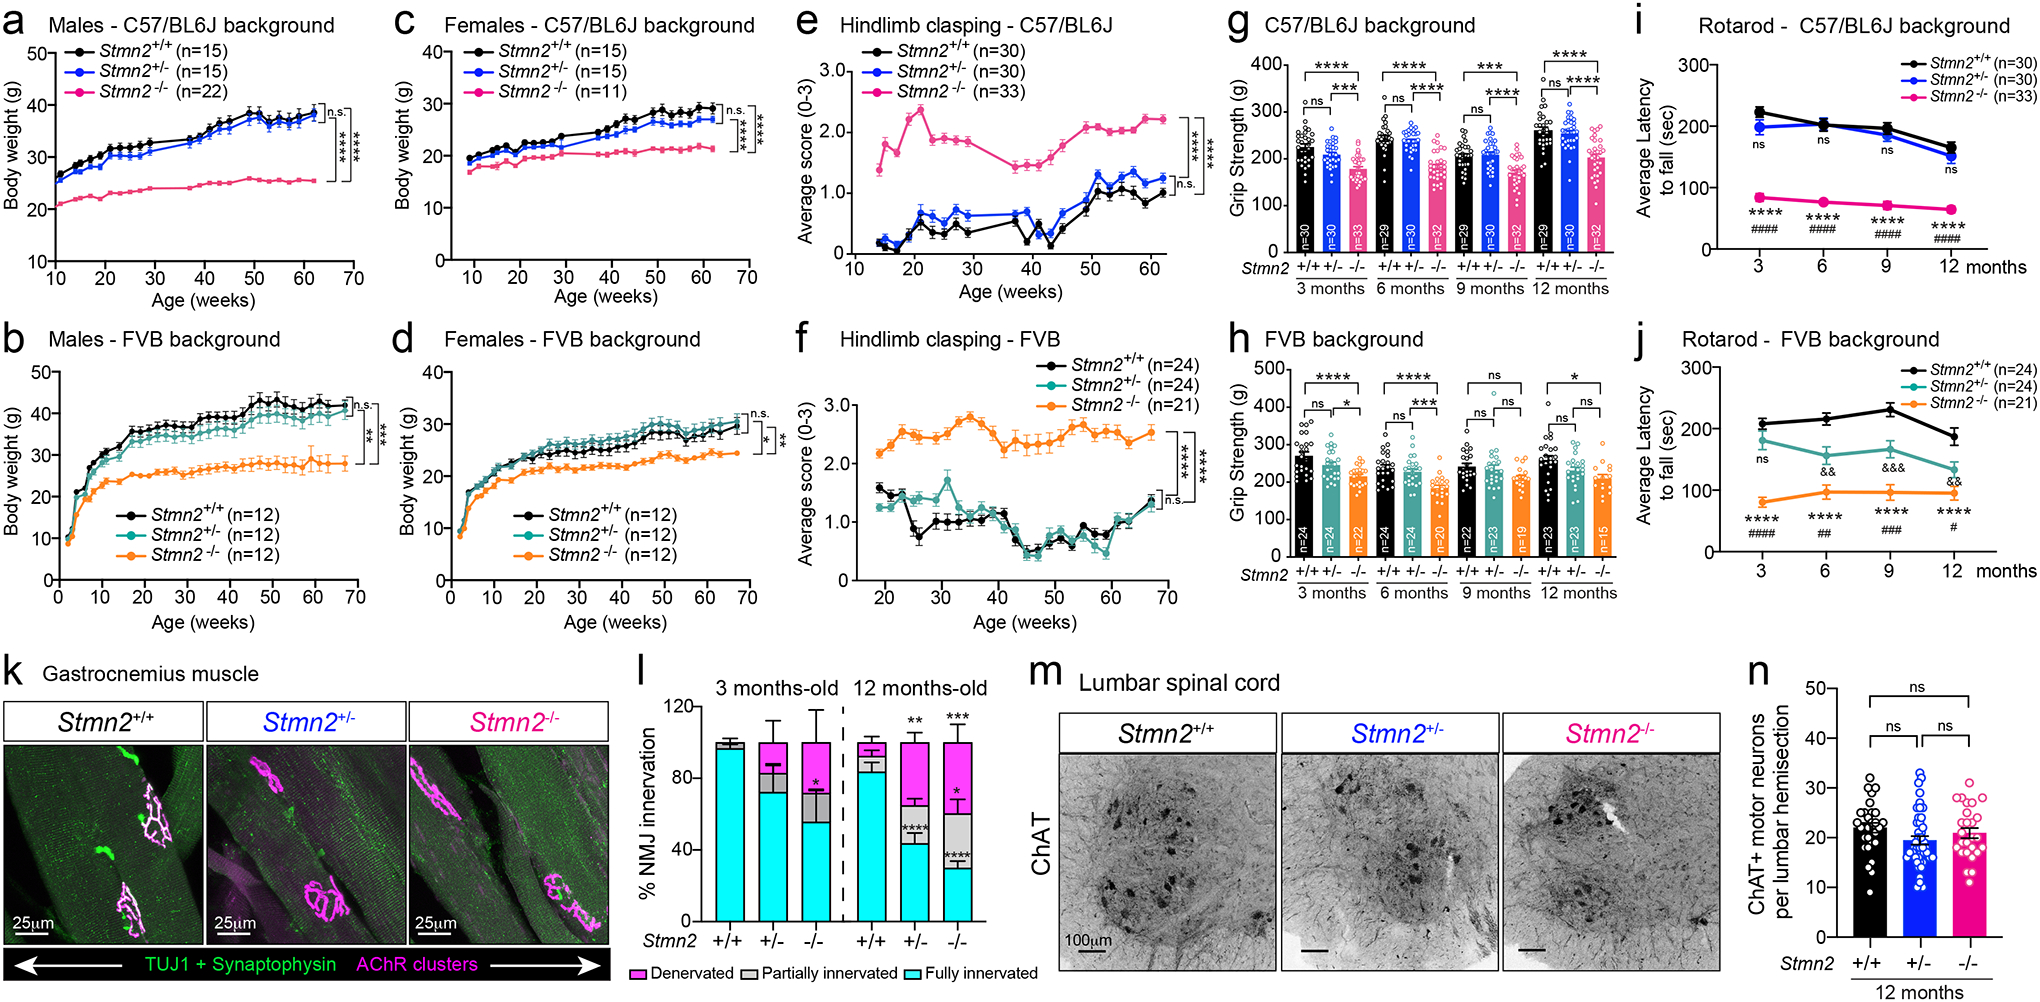
Figure 6: Absence of stathmin-2 results in motor deficits and muscle denervation without motor neuron loss.

(a-b) Body weight from Stmn2+/+, Stmn2+/− and Stmn2−/− male mice in C57/BL6J (a) and FVB backgrounds (b), and (c-d) female mice in C57/BL6J (c) and FVB (d) backgrounds. (e-f) Hindlimb clasping measurements of Stmn2+/+, Stmn2+/− and Stmn2−/− mice in C57/BL6J (e) and FVB (f) backgrounds. (a-f) Each dot represents the mean value per genotype in each time-point. Statistics by two-sided, two-way ANOVA post hoc Tukey’s multiple comparisons test. (g-h) Hindlimb grip strength measurements of Stmn2+/+, Stmn2+/− and Stmn2−/− mice at 3, 6, 9, and 12 months-old in C57/BL6J (g) or FVB (h) backgrounds. Each data point represents an individual mouse. Statistics by two-sided, one-way ANOVA post hoc Tukey’s multiple comparisons. (a-h) P value range from P = 0.0496 to P < 0.0001. Specific p values for each time-point are specified in Source Data for Figure 6. (i-j) Rotarod performance of Stmn2+/+, Stmn2+/− and Stmn2−/− mice at 3, 6, 9, and 12 months in C57/BL6J (i) or FVB (j) backgrounds. Each dot represents mean values per genotype in each time-point. Statistics by two-sided, two-way ANOVA post hoc Tukey’s multiple comparisons. *, #, and & represent statistical tests performed between Stmn2+/+ and −/−; Stmn2+/− and −/−; and Stmn2+/+ and +/−, respectively. (k) Gastrocnemius muscle from 12-month-old Stmn2+/+, Stmn2+/− and Stmn2−/− mice immunolabelled with synaptophysin and β3-tubulin (Tuj1) (green) for axon terminals, and α-bungarotoxin (magenta) for muscle endplates. (l) Innervation frequency quantified using confocal microscopy at 3- and 12-months. Statistics by two-sided, two-way ANOVA post hoc Tukey’s multiple comparisons test. N=3 animals/genotype at 3 months; n=4–5 animals/genotype at 12 months. P value range from P = 0.0396 to P < 0.0001. (m) Representative lumbar spinal cord ventral sections of 12-month-old Stmn2+/+, Stmn2+/− and Stmn2−/− mice immunolabelled with ChAT. (n) Quantification of ChAT positive motor neurons per hemisections. N= 5 animals/genotype. Statistical analysis by one-way ANOVA post hoc Tukey’s multiple comparisons. All panels: Error bars plotted as SEM. ****, P <0.0001; ***, P < 0.001; **, P < 0.01; *, P <0.05; ns, P >0.05.
