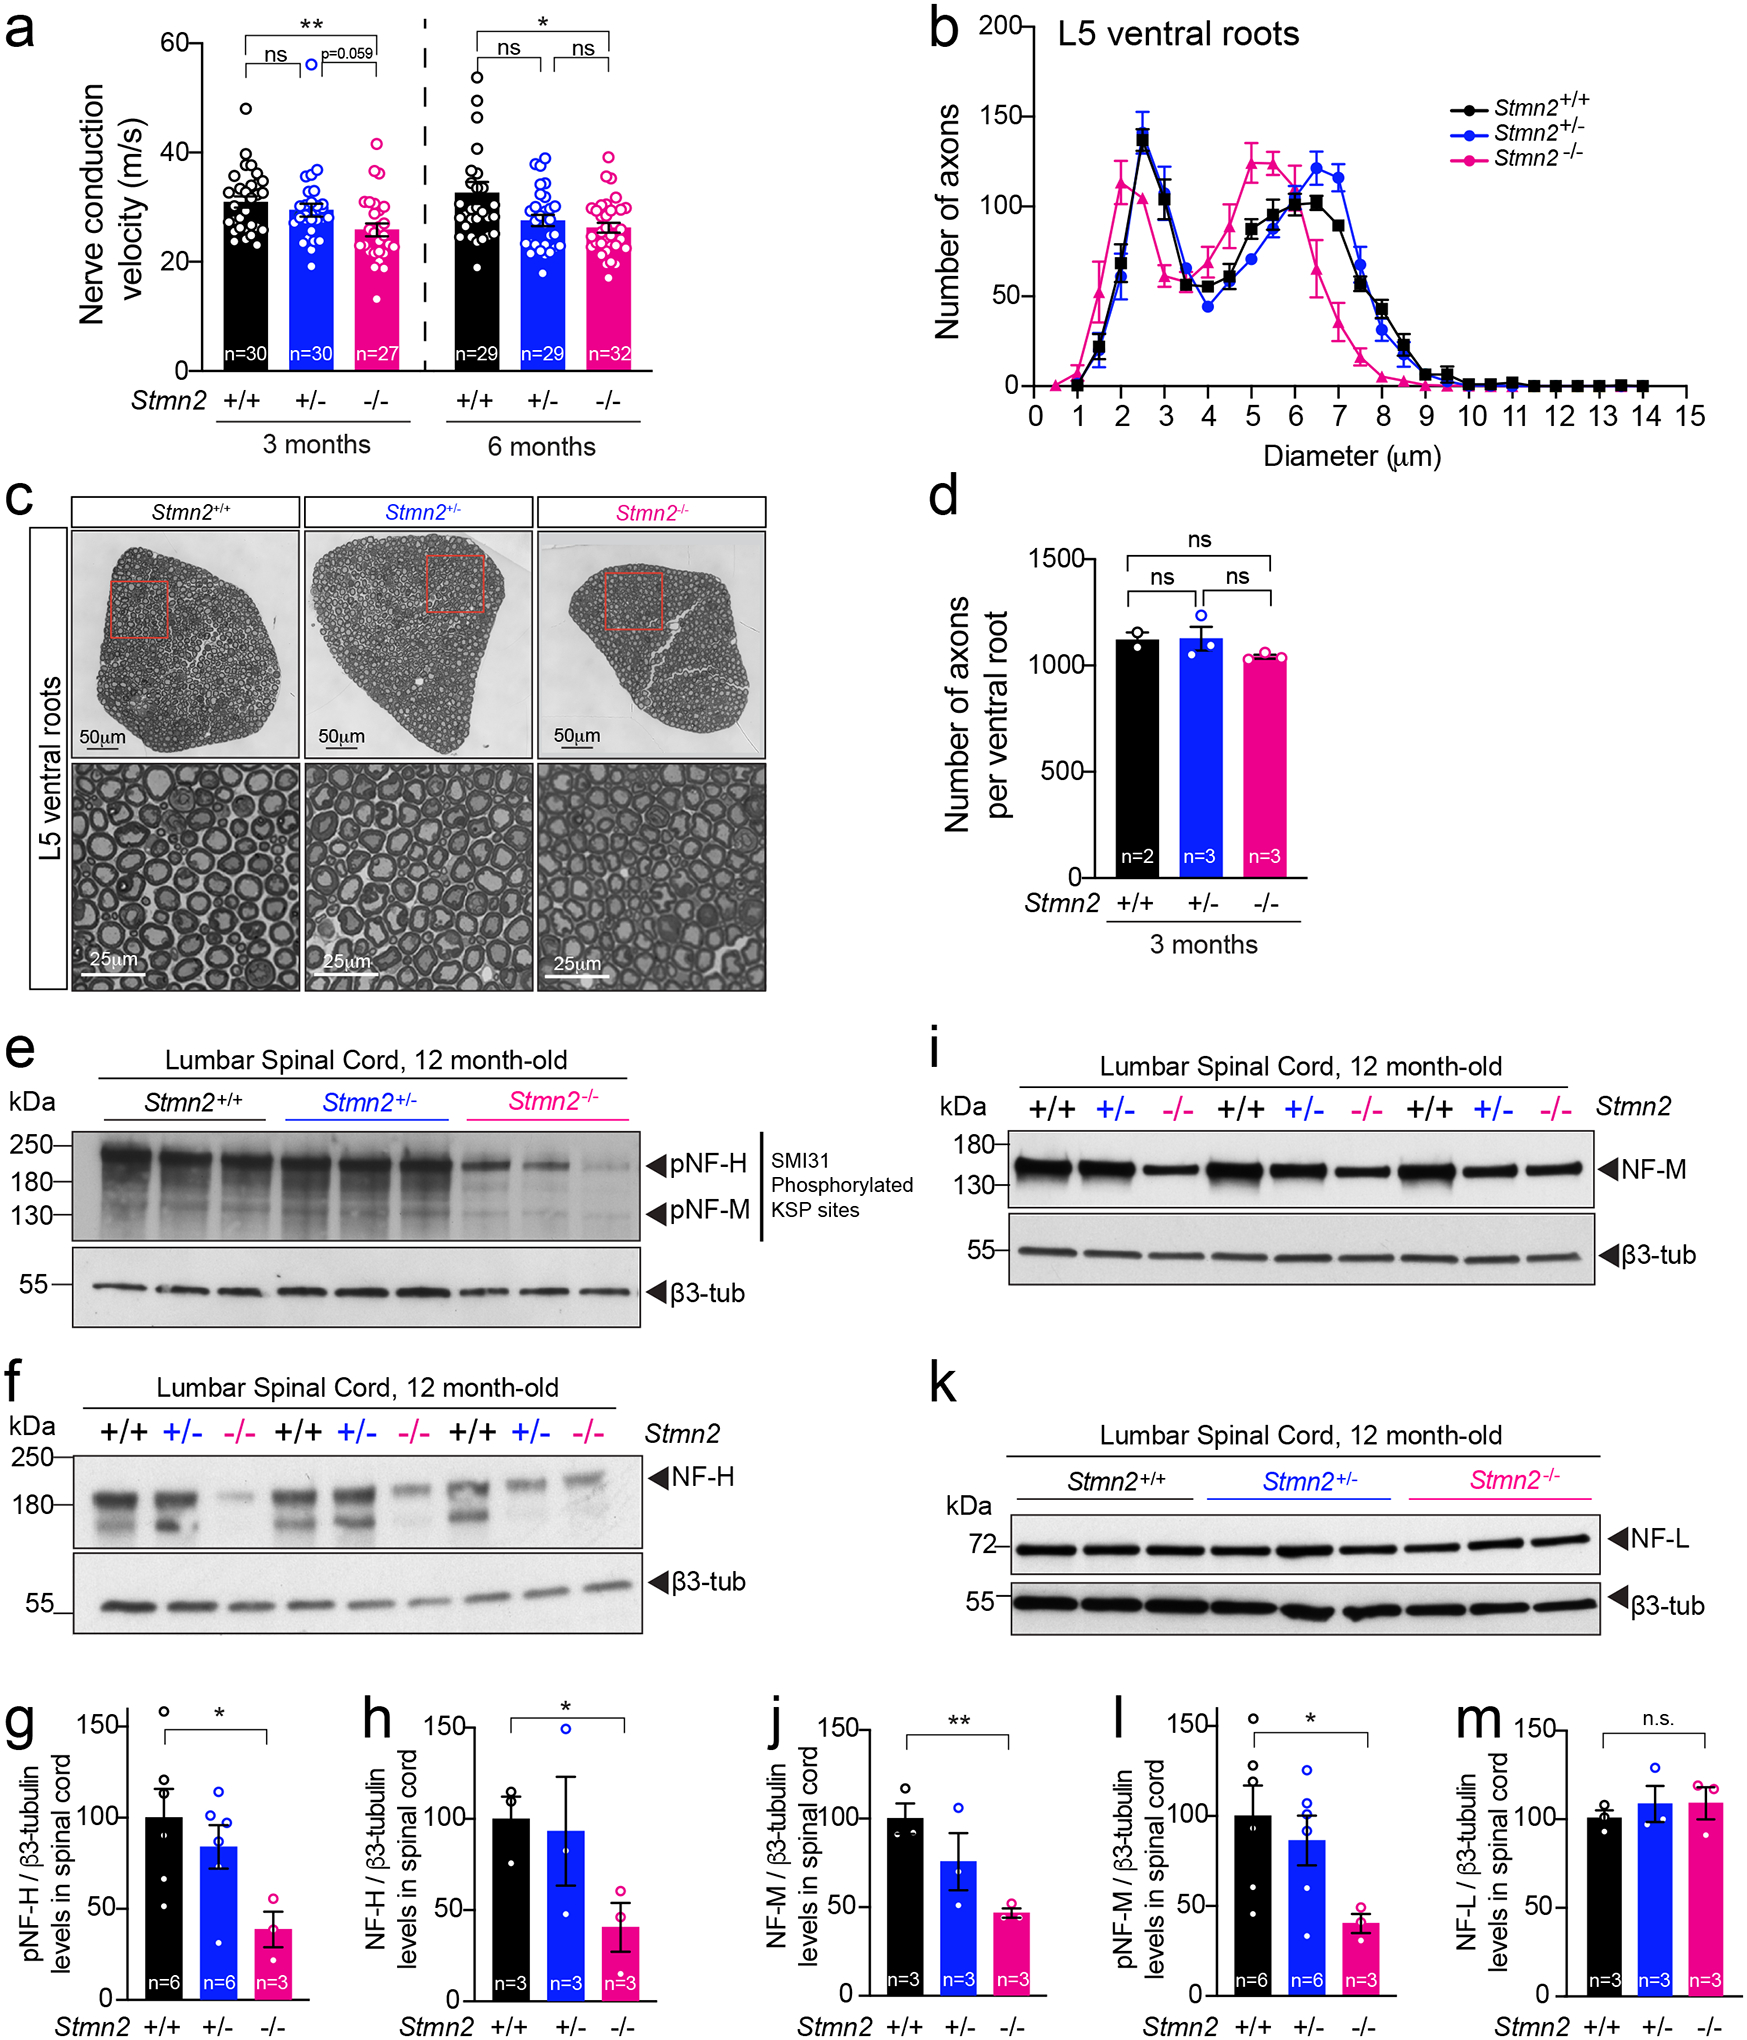
Figure 7: Absence of stathmin-2 reduces nerve conduction velocity and alters axonal radial growth, and neurofilament composition.

(a) Nerve conduction velocity of Stmn2+/+, Stmn2+/− and Stmn2−/− at 3 and 6 month of age in the C57/BL6J background. Each data point represents an individual mouse. Corresponding n number specified in the graph. Statistics by two-sided, Kruskal-Wallis post hoc Dunn’s multiple comparisons test. P = 0.0033 and P = 0.0162 at 3 and 6 months, respectively. (b) Size distribution of motor axons in the L5 ventral motor roots of 3-month-old Stmn2+/+, Stmn2+/− and Stmn2−/− mice in the C57/BL6J background. N= 2 for Stmn2+/+; n= 3 animals/genotype for Stmn2+/− and Stmn2−/−. (c) Representative motor roots micrographs and higher magnification images from 3-month-old Stmn2+/+, Stmn2+/− and Stmn2−/− mice in the C57/BL6J background showing reduced axon diameter in Stmn2−/−. (d) Number of total axons per L5 ventral root quantified in Stmn2+/+ (n=2 animals), Stmn2+/− (n=3 animals), and Stmn2−/− (n=3 animals). Statistics by two-sided, Kruskal-Wallis post hoc Dunn’s multiple comparisons test. (e,f) Immunoblotting for phosphorylated forms of neurofilament heavy (pNF-H) and neurofilament medium (pNF-M) (e) and total neurofilament heavy (NF-H) (f) in spinal cord protein extracts of 12 months-old Stmn2+/+, Stmn2+/− and Stmn2−/− mice. (g-h) Quantifications of pNF-H, (P = 0.0381) (g), NF-H, P = 0.0307 (h), and pNF-M, (P = 0.0486) (l), normalized to the amount of β3-tubulin in (e) and (f) respectively. β3-tubulin used as loading control since it remained unchanged upon the same amount of protein loading. Each data point represents an individual mouse. Corresponding n numbers specified in the graphs. Statistics by two-sided, unpaired t-test. (i-k) Immunoblotting for neurofilament medium (NF-M) (i) and neurofilament light (NF-L) (k) in spinal cord protein extracts of 12 months-old Stmn2+/+, Stmn2+/− and Stmn2−/− mice. Quantification for NF-M, (P = 0.0039) (j), and NF-L (m) normalized to the amount of β3-tubulin are shown. Each data point represents an individual mouse. Corresponding n numbers specified in the graphs. Statistics by two-sided, unpaired t-test. All panels: Error bars plotted as SEM. ****, P <0.0001; ***, P < 0.001; **, P < 0.01; *, P <0.05; ns, P >0.05.
