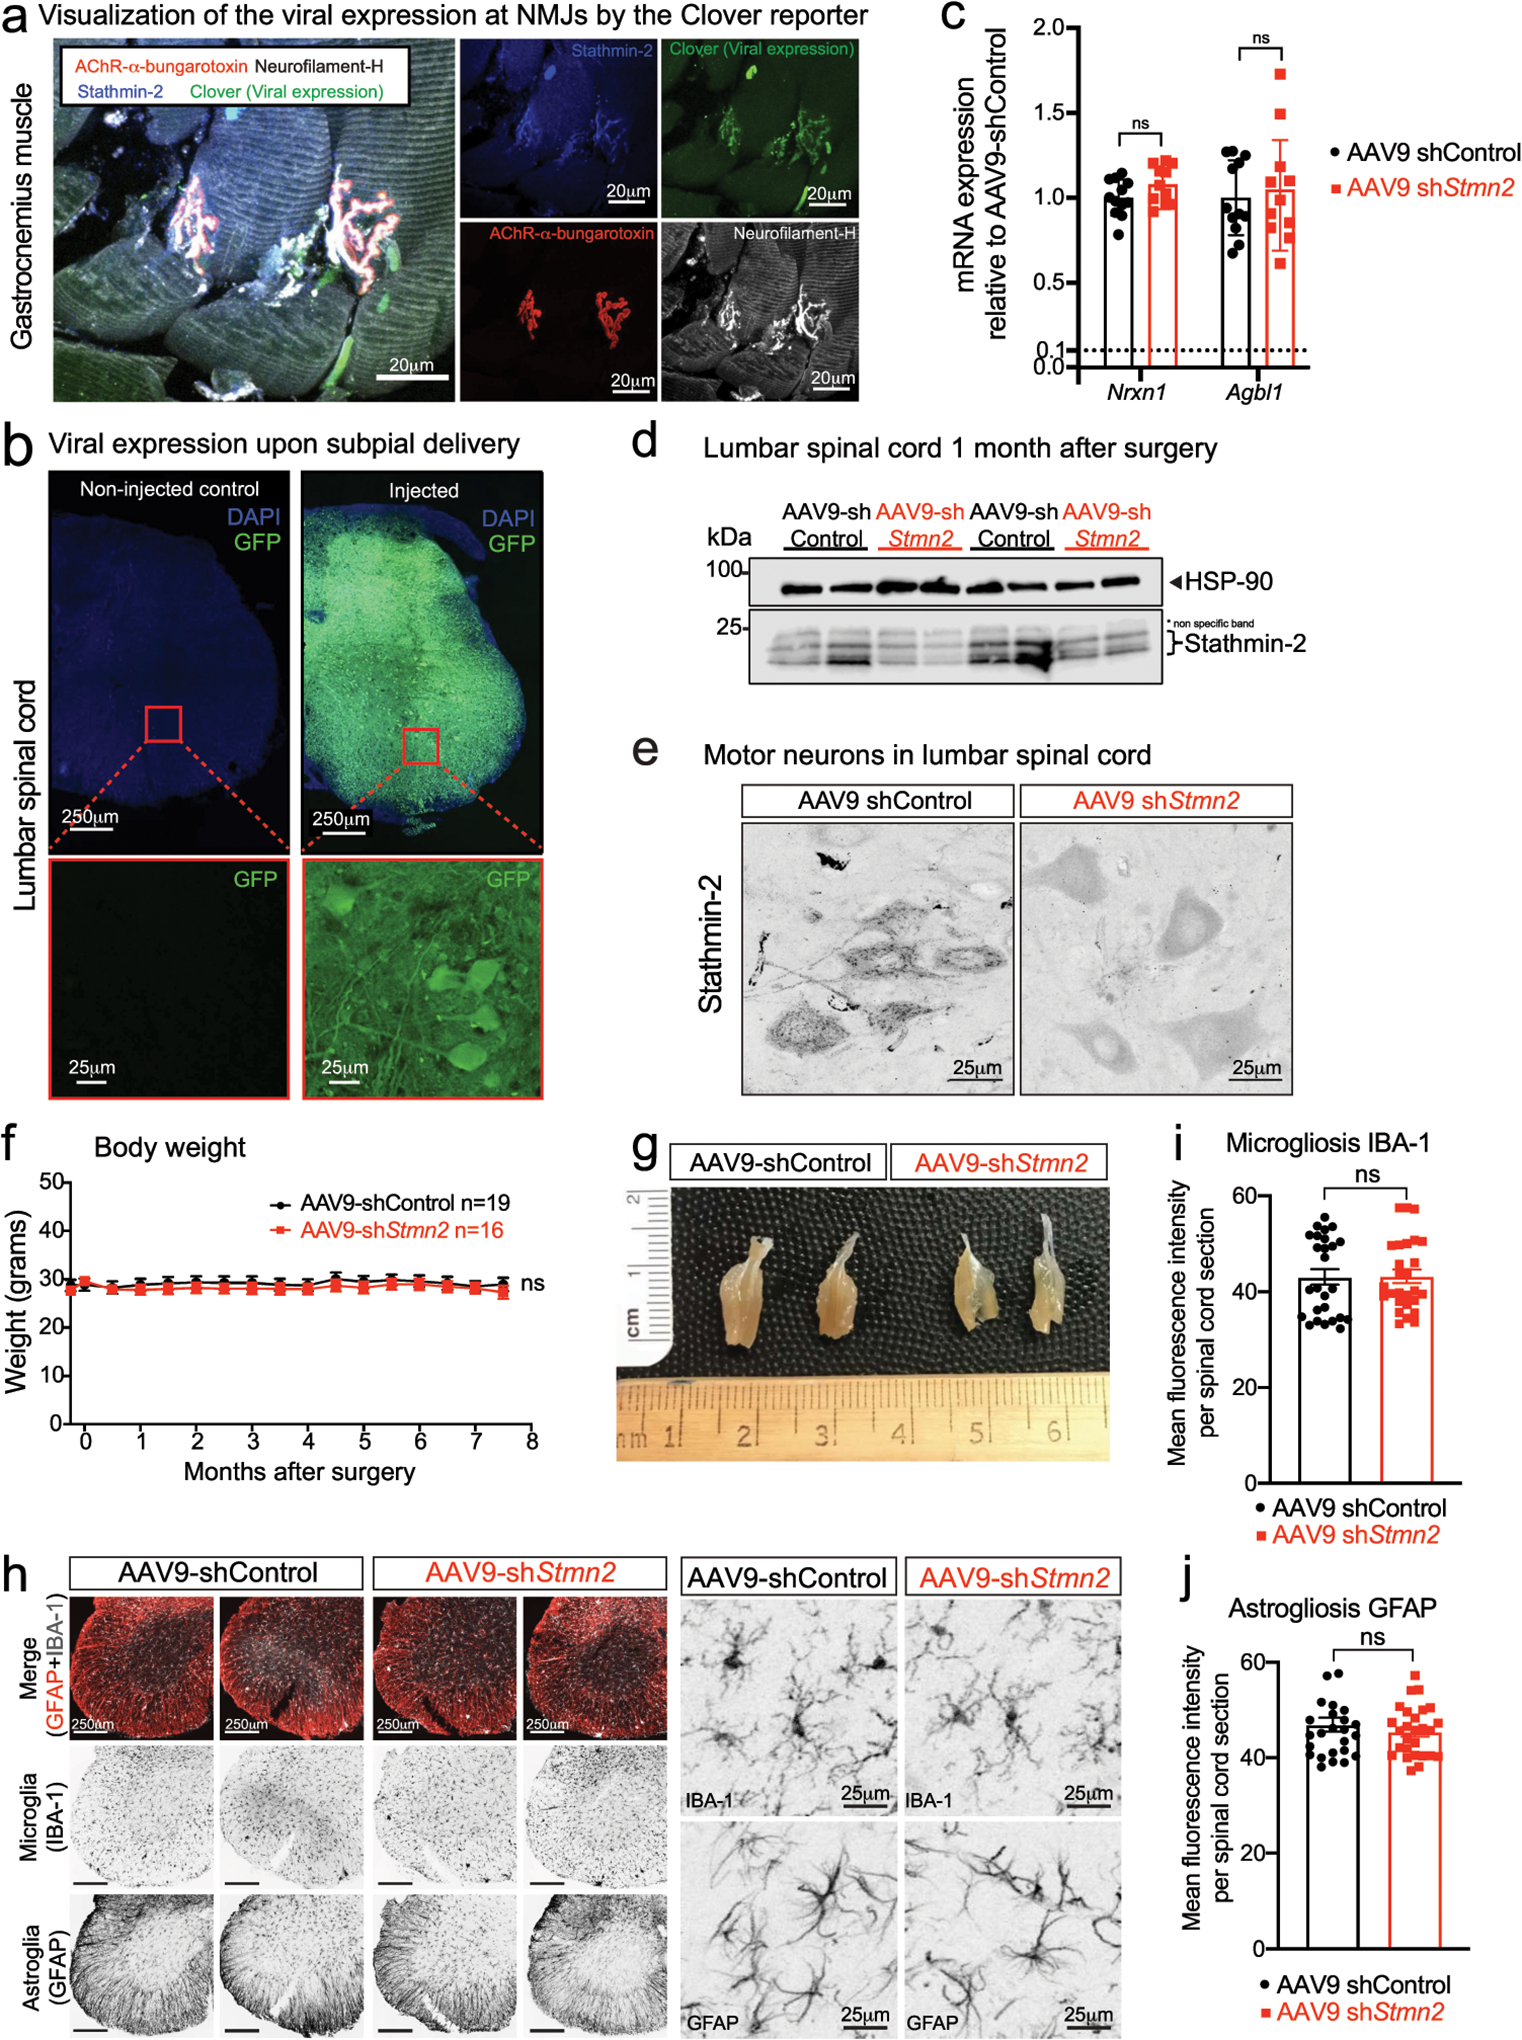
Extended Data Figure 2: Sustained stathmin-2 depletion induces axonal withdrawal from neuromuscular junctions without compromising motor neuron survival.

(a) Representative confocal image of gastrocnemius muscle stained for stathmin-2 (blue), muscle AChR clusters using α-bungarotoxin (red), direct imaging of clover in the 488-wavelength (green) representing viral expression, and neurofilament-H (white). At least n=3 animals were imaged with similar results. (b) Representative image of lumbar spinal cord of non-injected (left) and 2 months after subpial injection with AAV9 expressing green fluorescent protein (GFP) (right) with the respective high magnification images of the ventral spinal cord regions, below each panel. At least n=3 animals were imaged with similar results. (c) Measurement in lumbar spinal cord segments at 8-months post injection of control or Stmn2 targeting AAV9 of potential off-target genes by qRT-PCR. N=12 animals with AAV9-shControl and n=11 animals with AAV9-shStmn2. Gapdh was used as an endogenous control gene. Statistics by two-sided, unpaired t-tests. (d) Immunoblots to determine stathmin-2 protein level in mouse lumbar spinal cord 1-month after subpial injection of a Stmn2 reducing AAV9 or control shRNA. HSP-90 was used as a loading control. *Indicates non-specific band. (e) Mouse lumbar spinal cord immunofluorescence micrographs visualized with stathmin-2 antibody 8 months after subpial injection into the lumbar spinal cord of non-targeting control or Stmn2-reducing AAV9. (f) Bi-weekly measurements of mouse body weight after subpial injection of AAV9 encoding either non-targeting or Stmn2-targeting shRNA. Statistics by two-sided, two-way ANOVA and Sidak’s multiple comparison test. (g) Representative images of entire gastrocnemius muscles from mice 8 months after subpial delivery of AAV9 encoding either a non-targeting or an Stmn2-shRNA AAV9. (h-j) Representative immunofluorescence images of mouse lumbar spinal cord stained with the microglial and astrocytic markers IBA1 and GFAP (h) and quantification of microgliosis (i) and astrogliosis (j), 8 months after subpial delivery of a non-targeting control (n=4 animals) or Stmn2-targeting AAV9 shRNA (n=4 animals). Statistics by two-sided, unpaired t-tests. All panels: Each data point represents an individual mouse. Error bars plotted as SEM. ns, p>0.05.
