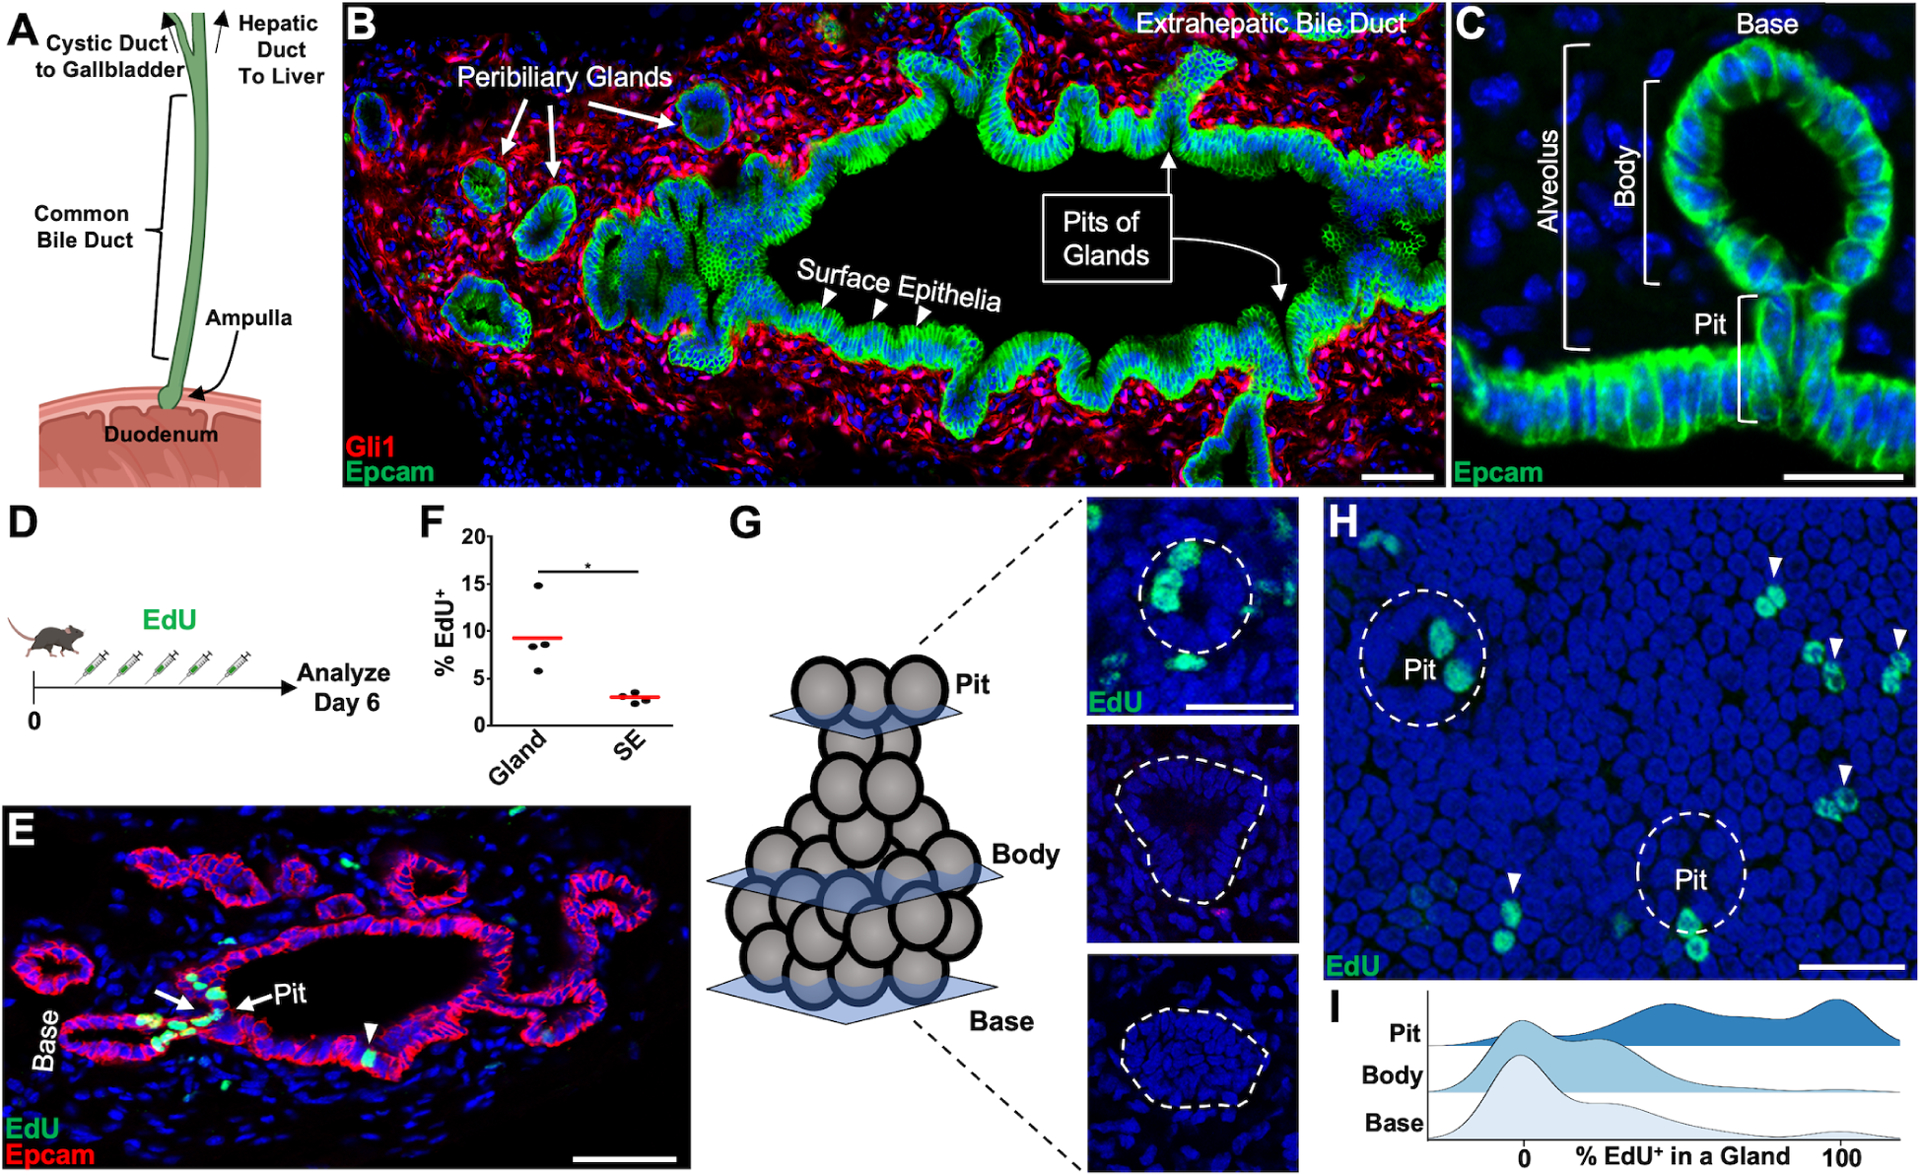
Figure 1. Localizing Proliferation in the Extrahepatic Bile Duct.

(A) Schematic of the extrahepatic biliary tree. (B) The CBD from a Gli1:CreERT2; Rosa26:lox-STOP-lox-tdTomato animal where mesenchyme is labeled. Peribiliary glands (thick arrows) connect with the surface epithelia (arrowheads) through pits (thin arrows). (C) A single alveolar gland with gland pit, body, and base diagramed. (D) Animals were pulsed with EdU daily for 5 total doses and analyzed 1 day after. (E) A cluster of EdU+ cells is seen around the pit of a gland (arrows), with lower labeling on the surface epithelium (arrowhead). (F) Quantification of EdU+ cholangiocytes seen in surface and glandular epithelium from sections (n = 4 animals). (G) Optical sections through the gland base, body, and pit. (H) EdU+ surface epithelia (arrowheads) and pit cholangiocytes (dashed line encompasses gland pit). (I) Ridge plot showing percentage of EdU+ cholangiocytes found in a gland by region (102 glands from n = 4 animals). Scale bars, 50 μm (B, E); 25 μm (C, G, H). * p<0.05, by Students t-test.
