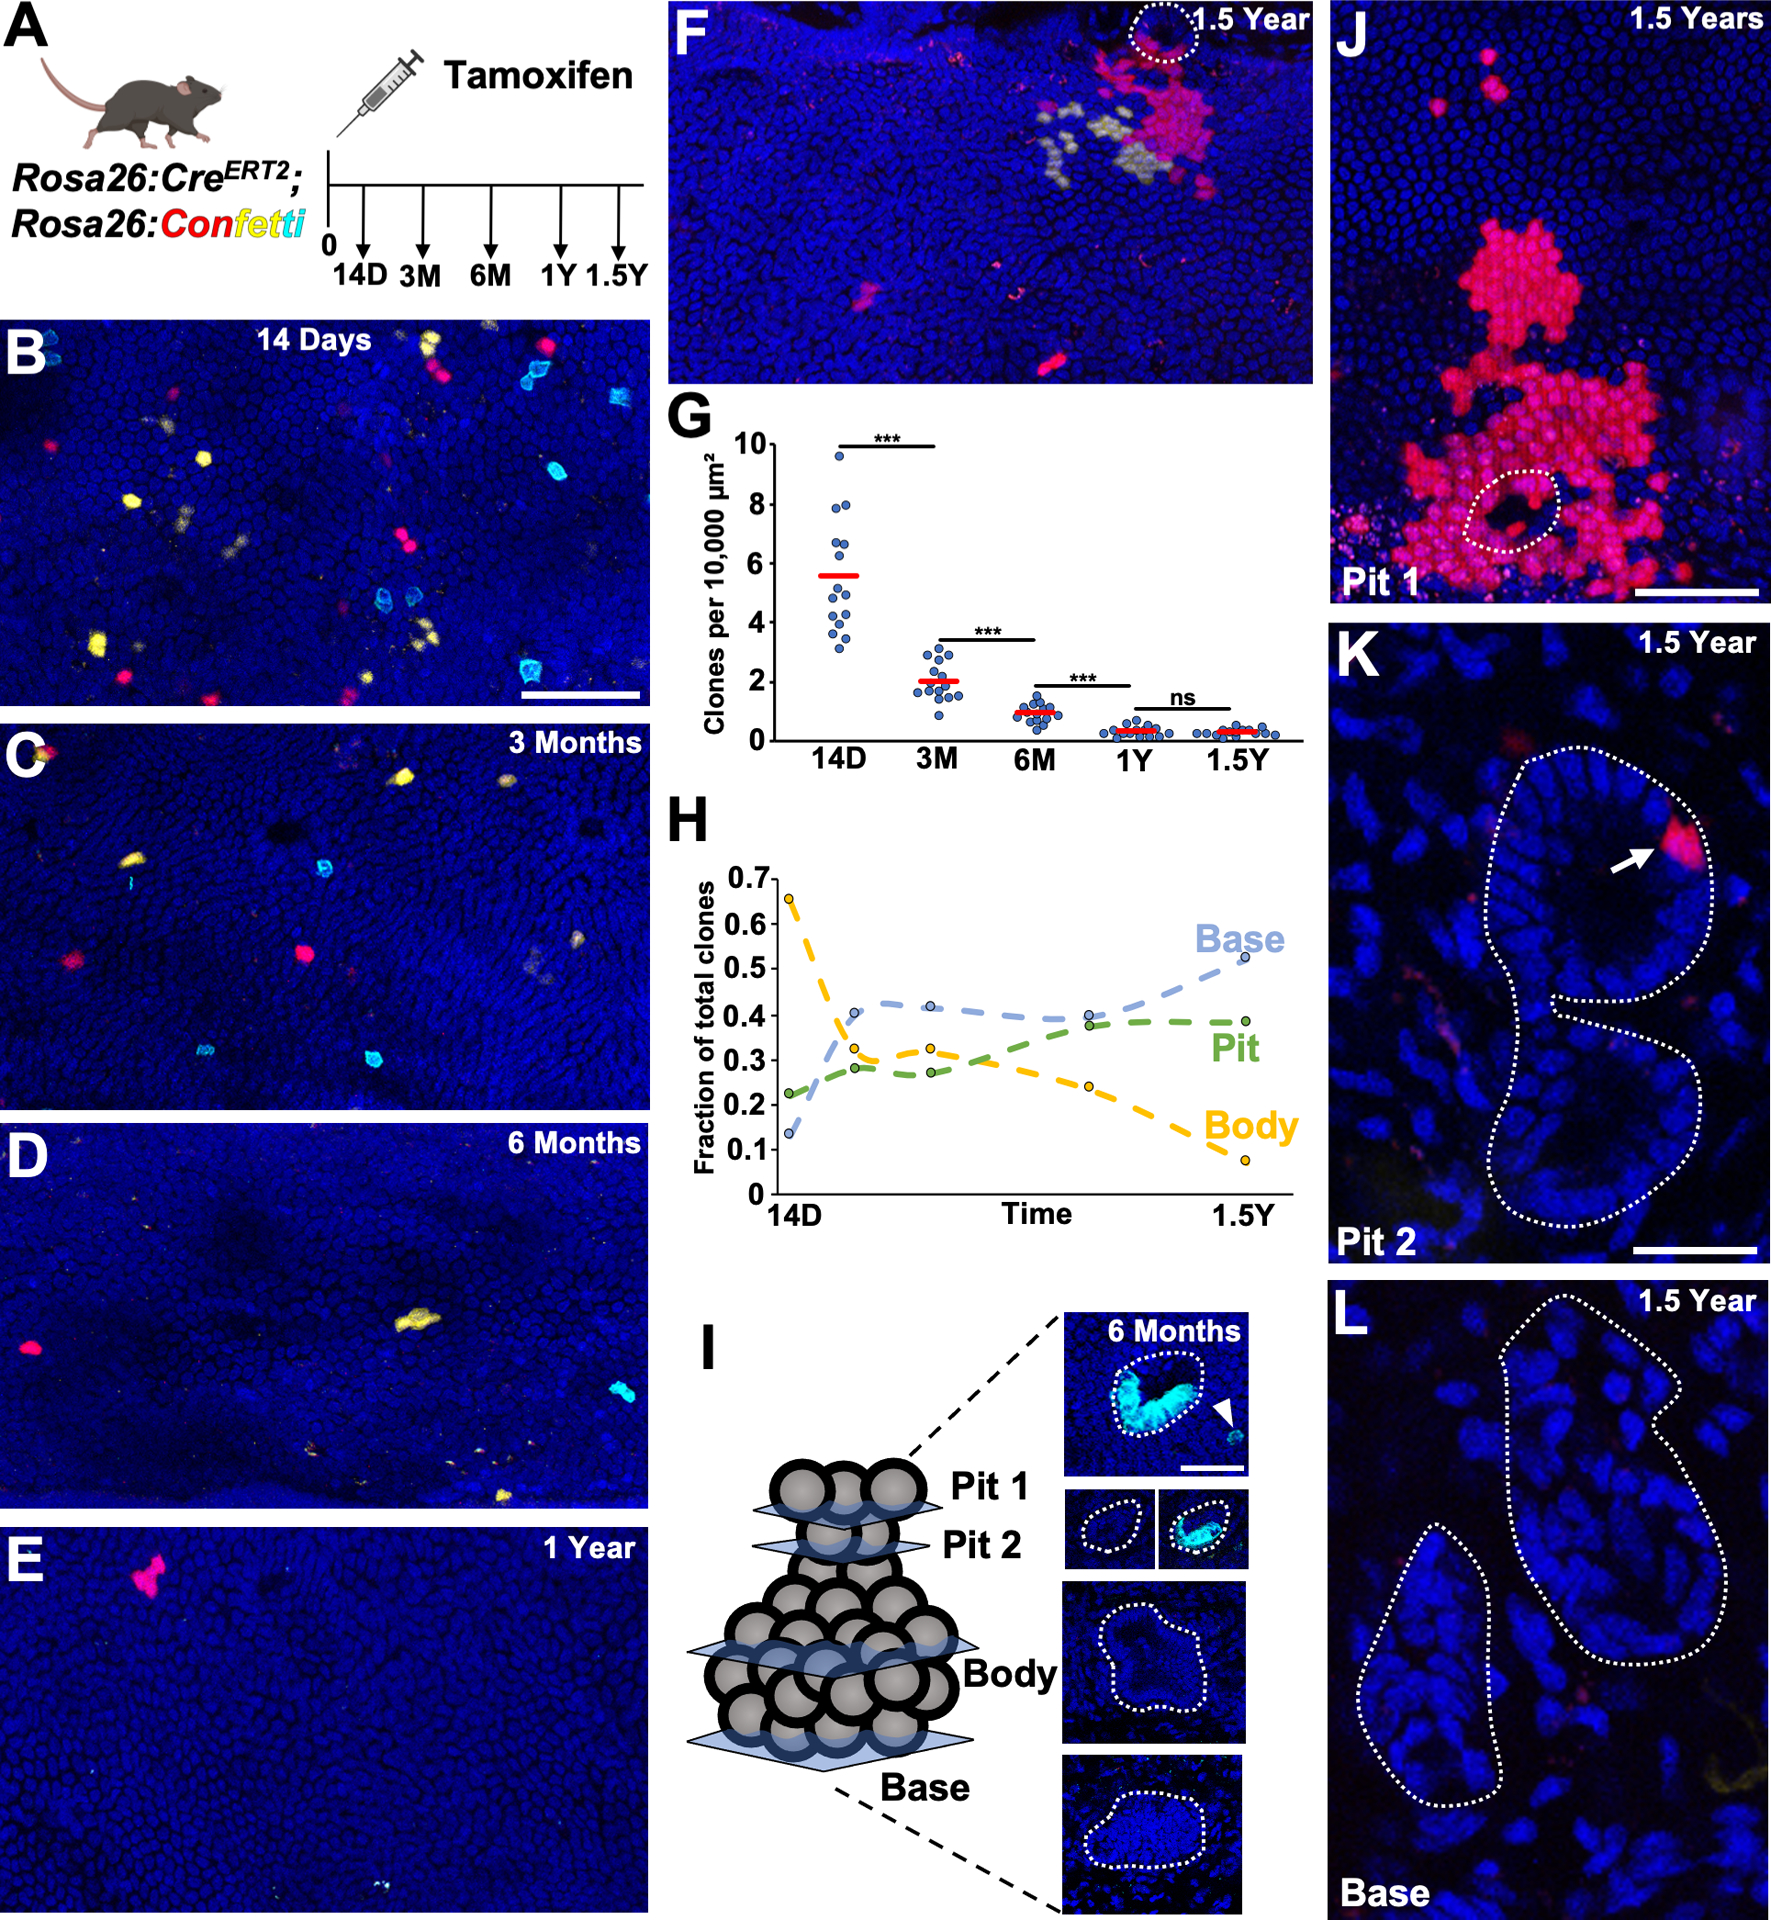
Figure 2. Non-biased Lineage Tracing of the Common Bile Duct.

(A) Schematic of experimental design. (B-F) Surface epithelial panels at indicated timepoints with (F) showing a red clone coming from the pit of a gland (in dashed outline) adjacent to a yellow clone. (G) Number of clones per area quantified from 5 luminal panels per animal (n = 3 animals for each timepoint). (H) Fraction of body encompassed, pit and base anchored clones (97 to 157 glands, n = 3 animals per timepoint). (I) Example of a 6 month gland where a cyan clone has expanded around the gland pit (Pit 2 panels with and without cyan channel, just above surface epithelium) and a corresponding cyan surface epithelial cell is in close proximity (Pit 1, arrowhead). (J-L) A two alveoli extramural gland (L, dashed outline around gland) with a red clone seen in the proximal gland pit (K, arrow), which has spread over the surface epithelium (J, dashed outlines indicates pit). Scale bars, 50 μm (B, C-F same scale as B, J); 25 μm (I, K, L same scale as K). *** p<0.001, ns = not significant, by Students t-test.
