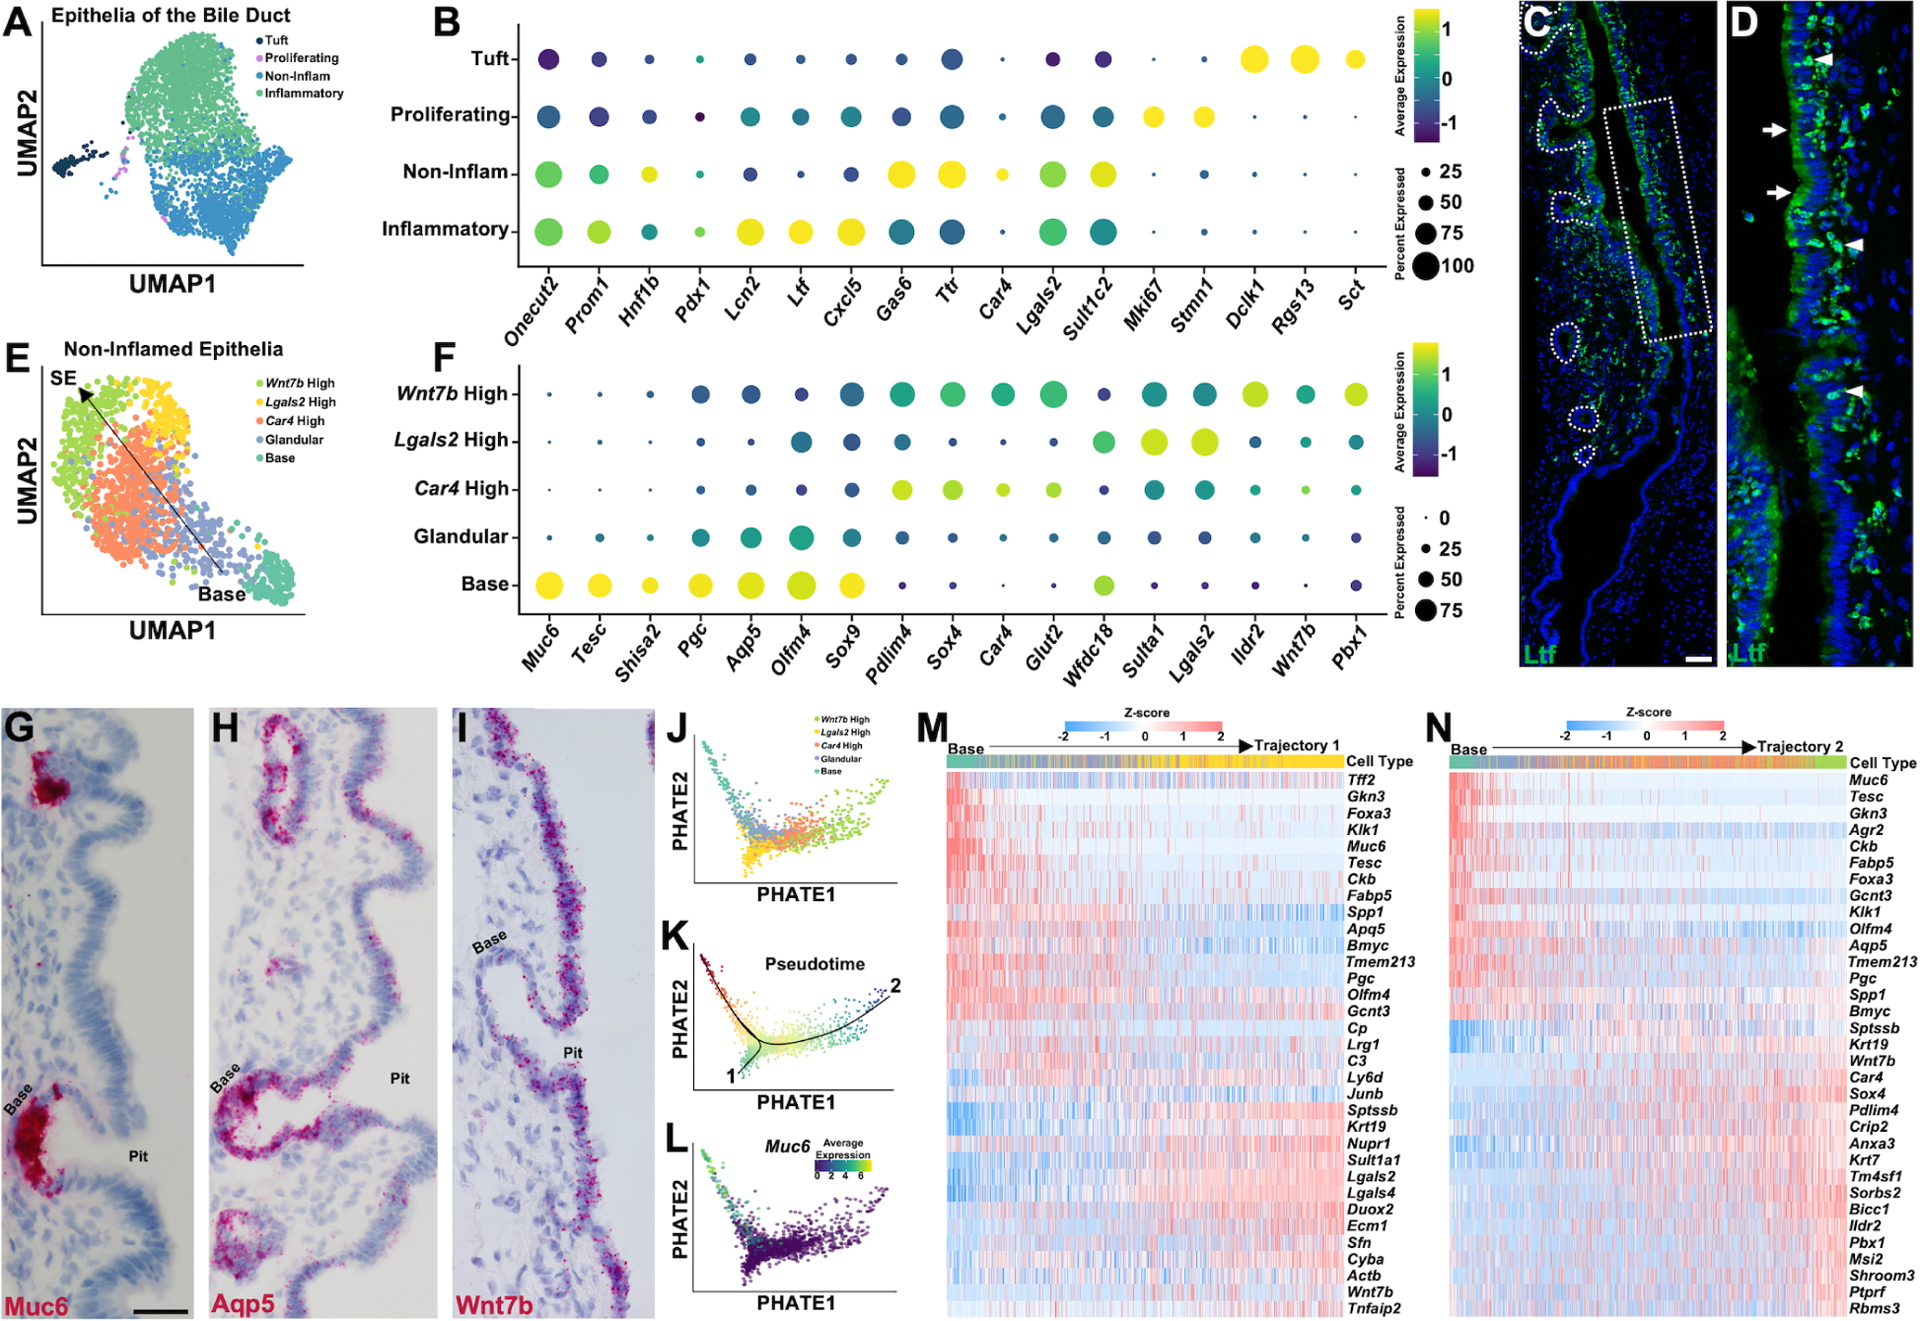
Figure 3. Single-Cell and Spatial Characterization of Biliary Epithelia.

(A) UMAP reduction showing epithelia of the CBD. (B) Dot plot showing expression level of common and marker genes for each cluster from (A). (C) Ltf staining showing an area of high expression that stops abruptly. (D) Zoom of dashed box from (C), where cholangiocytes show Ltf expression in apical aspect (arrows) and small Ltf+ cells (arrowheads) are infiltrating in-between epithelial cells. (E) UMAP reduction showing non-inflamed epithelial cells. (F) Dot plot showing marker gene expresion for each cluster from (E). (G-I) Muc6 (G), Aqp5 (H), and Wnt7b (I) in situs on CBD. (J) Two-dimensional PHATE embeddings of non-inflamed epithelial cells colored by identified cell types in (E). (K) Two trajectories inferred by Slingshot along pseudotime. (L) Expression level of Muc6 along trajectory. (M and N) Heatmap showing dynamically expressed genes over pseudotime along each trajectory. Scale bars, 50 μm (H and I same scale as G).
