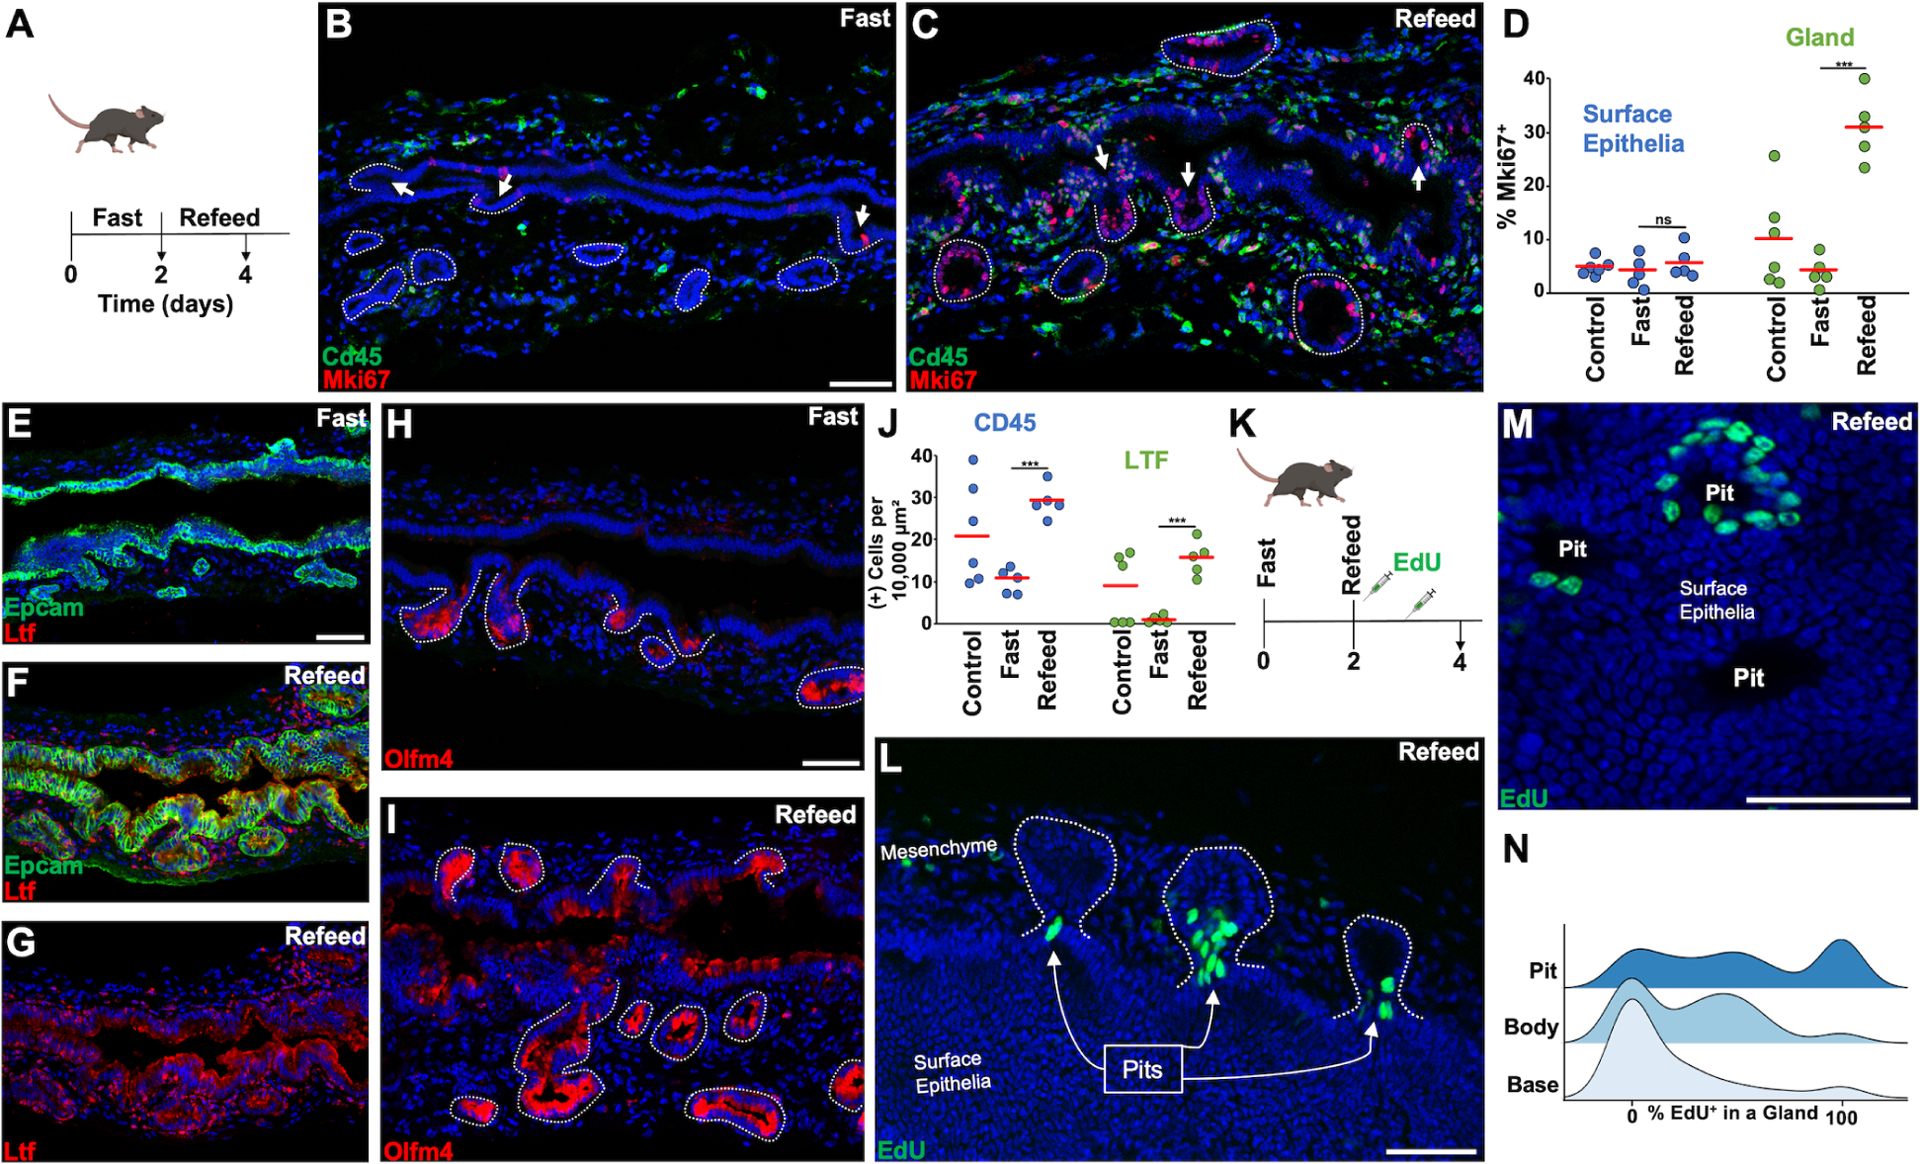
Figure 4. Fasting and Refeeding Modulate Cellular Identity and Glandular Proliferation.

(A) Fasting animals were fasted for two days before harvesting and refeed animals were allowed to eat ad libitum for two days before harvesting. (B and C) Cd45 and Mki67 staining with arrows indicating pits and dashed lines encircling glands. (D) Quantification of Mki67+ surface and glandular epithelia in randomly selected animals versus animals after fasting, and fast/refeeding (n = 5–6 animals per group). (E and F) Ltf staining in fasting and refeed states. (G) Ltf channel from (F). (H and I) Olfm4 staining in fasting and refeed states. (J) Quantification of Cd45+ and Ltf+ cells located within the mesenchymal space in the indicated states (n = 5–6 animals per group). (K) Animals were pulsed with EdU 6hrs after refeeding and 24hrs after refeeding. (L) 3 glands (in dashed outlines) with EdU+ pit cells 2 days after refeeding. (M) The pits of 3 glands seen from the aspect of the surface epithelium. (N) Ridge plot showing percentage of EdU+ cholangiocytes found in a gland by region in the refeed state (102 glands from n = 4 animals). Scale bars, 50 μm (C same scale as B, F and G same scale as E, I same scale as H). *** p<0.001, ns = not significant, by Students t-test.
