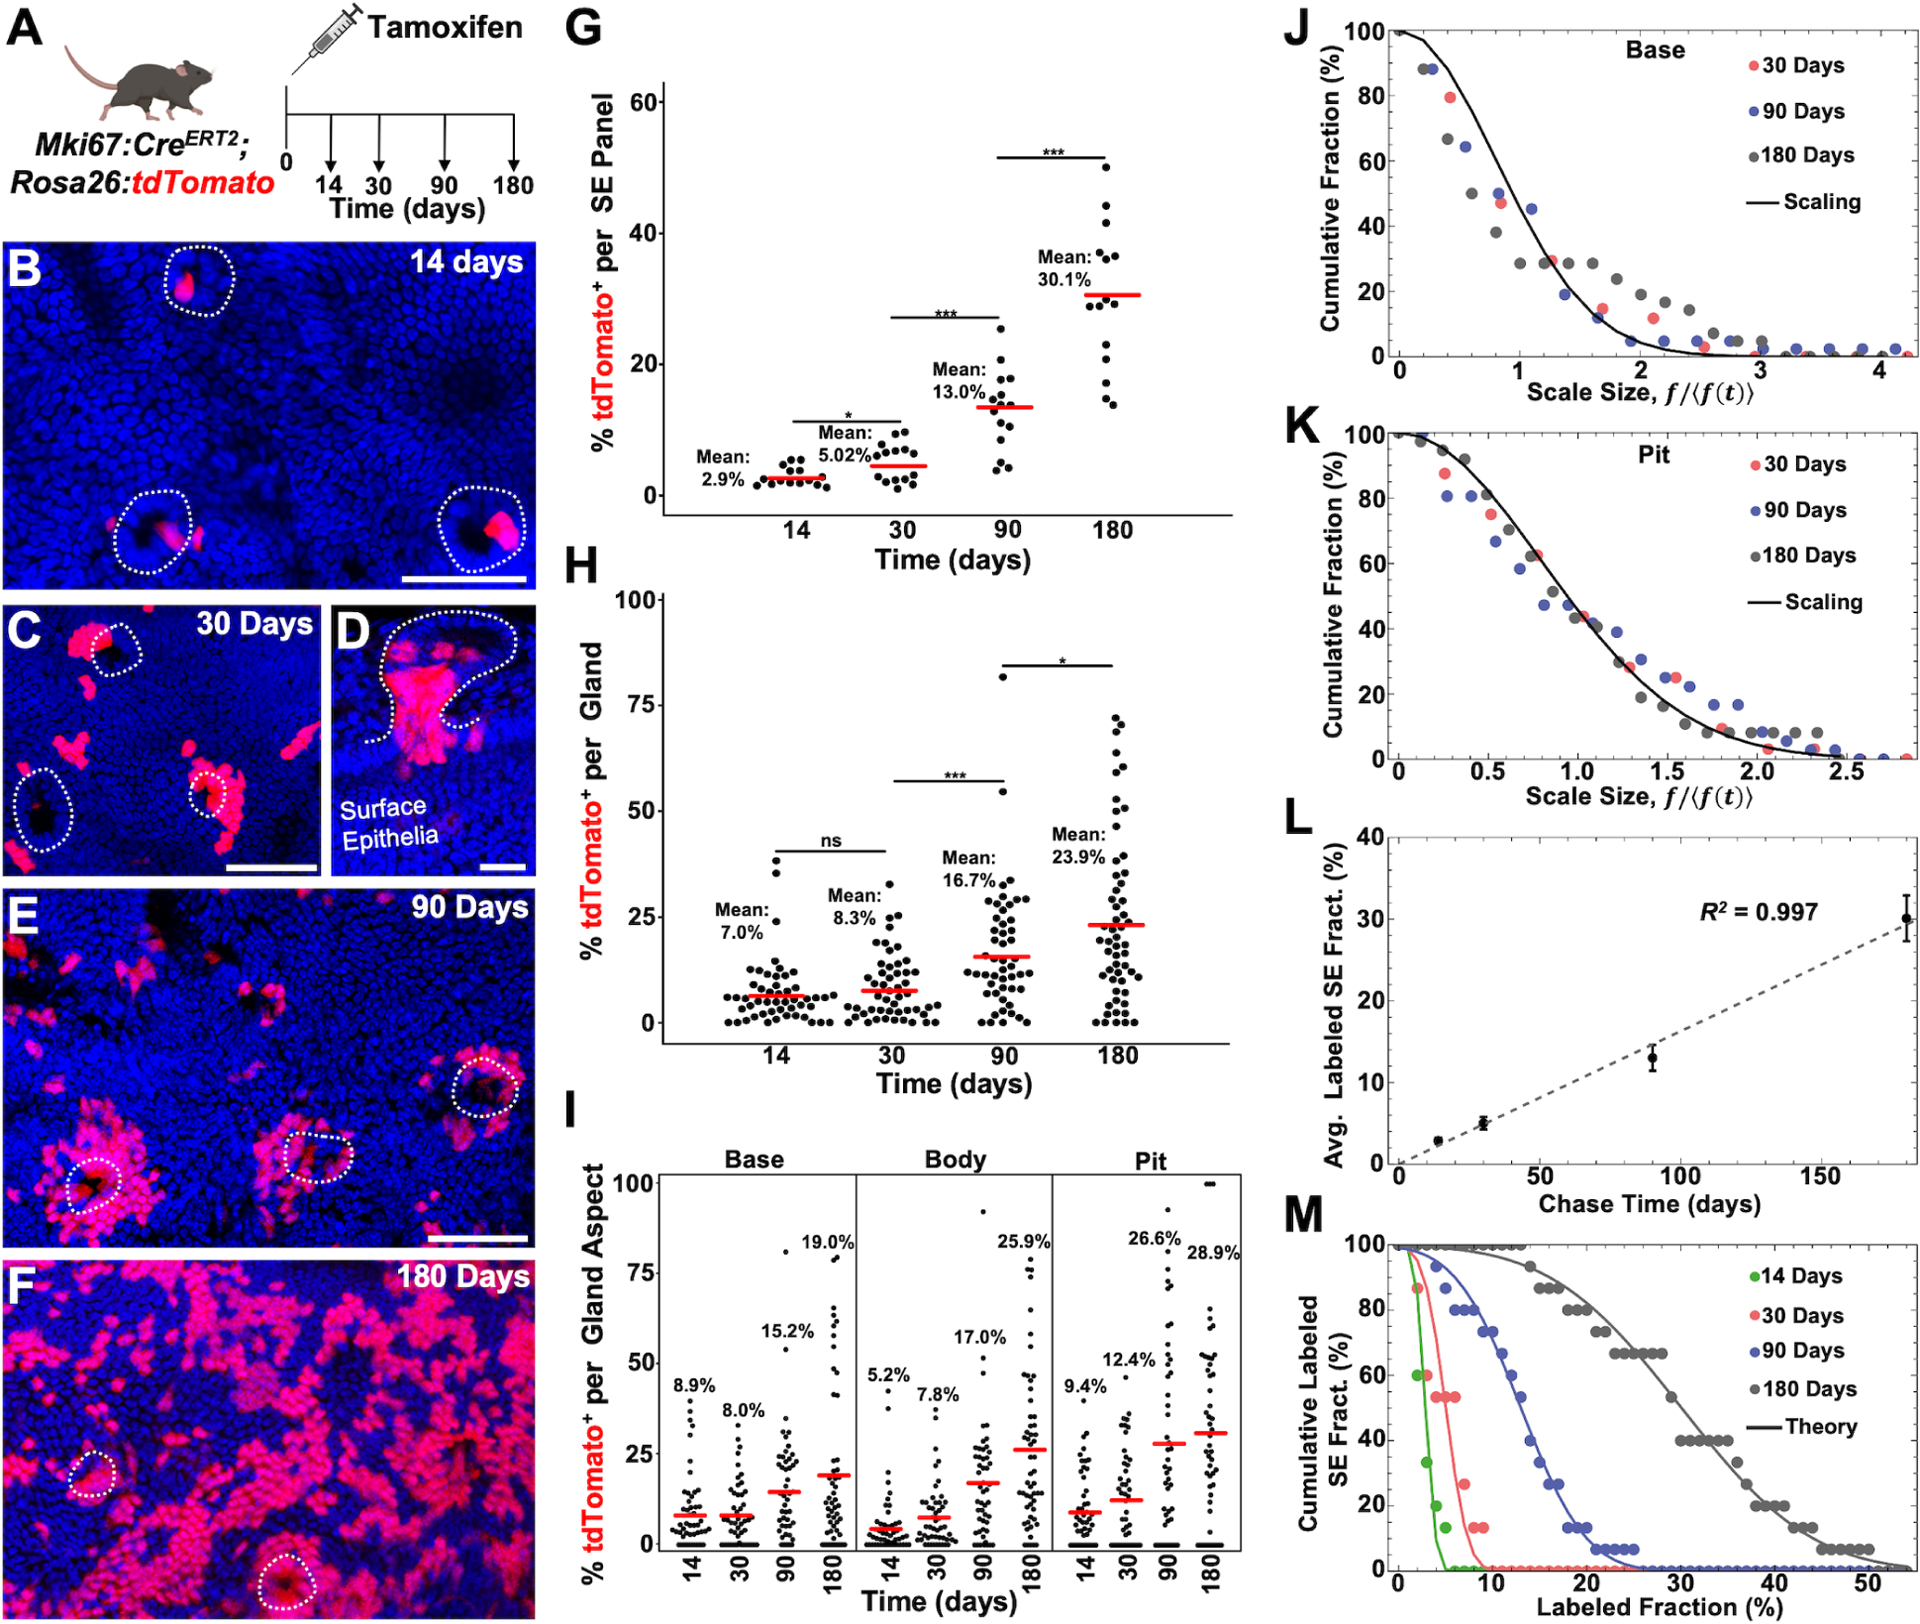
Figure 5. Peribiliary Pit Directed Lineage Tracing.

(A) Schematic showing experimental design. (B and C) Surface epithelial panels from 14 (B) and 30 (C) days post tamoxifen in which gland pits (dashed lines) can be seen with labeled cells. (D) Gland (outlined) from 30 days post tamoxifen in continuity with the surface epithelium where high pit labeling is seen. (E and F) Surface epithelial panels from 90 (E) and 180 (F) days post tamoxifen with peribiliary pits outlined. (G) Percent labeling of the surface epithelium from 5 low power panels (n = 3 animals per timepoint). (H) Percent labeling of peribiliary glands (49 to 58 total glands from n = 3 animals per timepoint). (I) Percent labeling of the gland base, body, and pit. (J and K) Cumulative distribution of fractional labeling in the gland base (J) and pit (K) as a function of the rescaled fraction, f/〈f (t)〉, where 〈f(t)〉 denotes the average fraction of cells in glands with non-zero base labeling at chase time t. The line shows the parameter-free statistical scaling curve exp[−πx2/4] predicted for neutral clone dynamics around the circumference of the base and pits regions (for details, see Supplementary Theory). (L) Average labeled cell fraction on the surface epithelium as a function of chase time. Note that the average size grows approximately linearly with time, as predicted by a model based on the neutral competition of surface epithelial cells, fed by migrating cells from the pit. Points show data (error bars denotes standard error. Line shows a linear fit with a slope of 0.16 per day). (M) Cumulative distribution of labeled cell fraction in the surface epithelium. The points show data and lines shows the Gaussian-like prediction of the model at the four chase times (14 days, 30 days, 90 days and 180 days from left to right). For a Gaussian distribution, the cumulative distribution translates to the Error function, , where the factor 0.063 is inferred from the linear fit to the standard deviation of the fraction distribution and t denotes the chase time. Scale bars, 50 μm (B,C,E, F same scale as E); 25 μm (D). * p<0.05, *** p<0.001, ns = not significant, by Students t-test.
