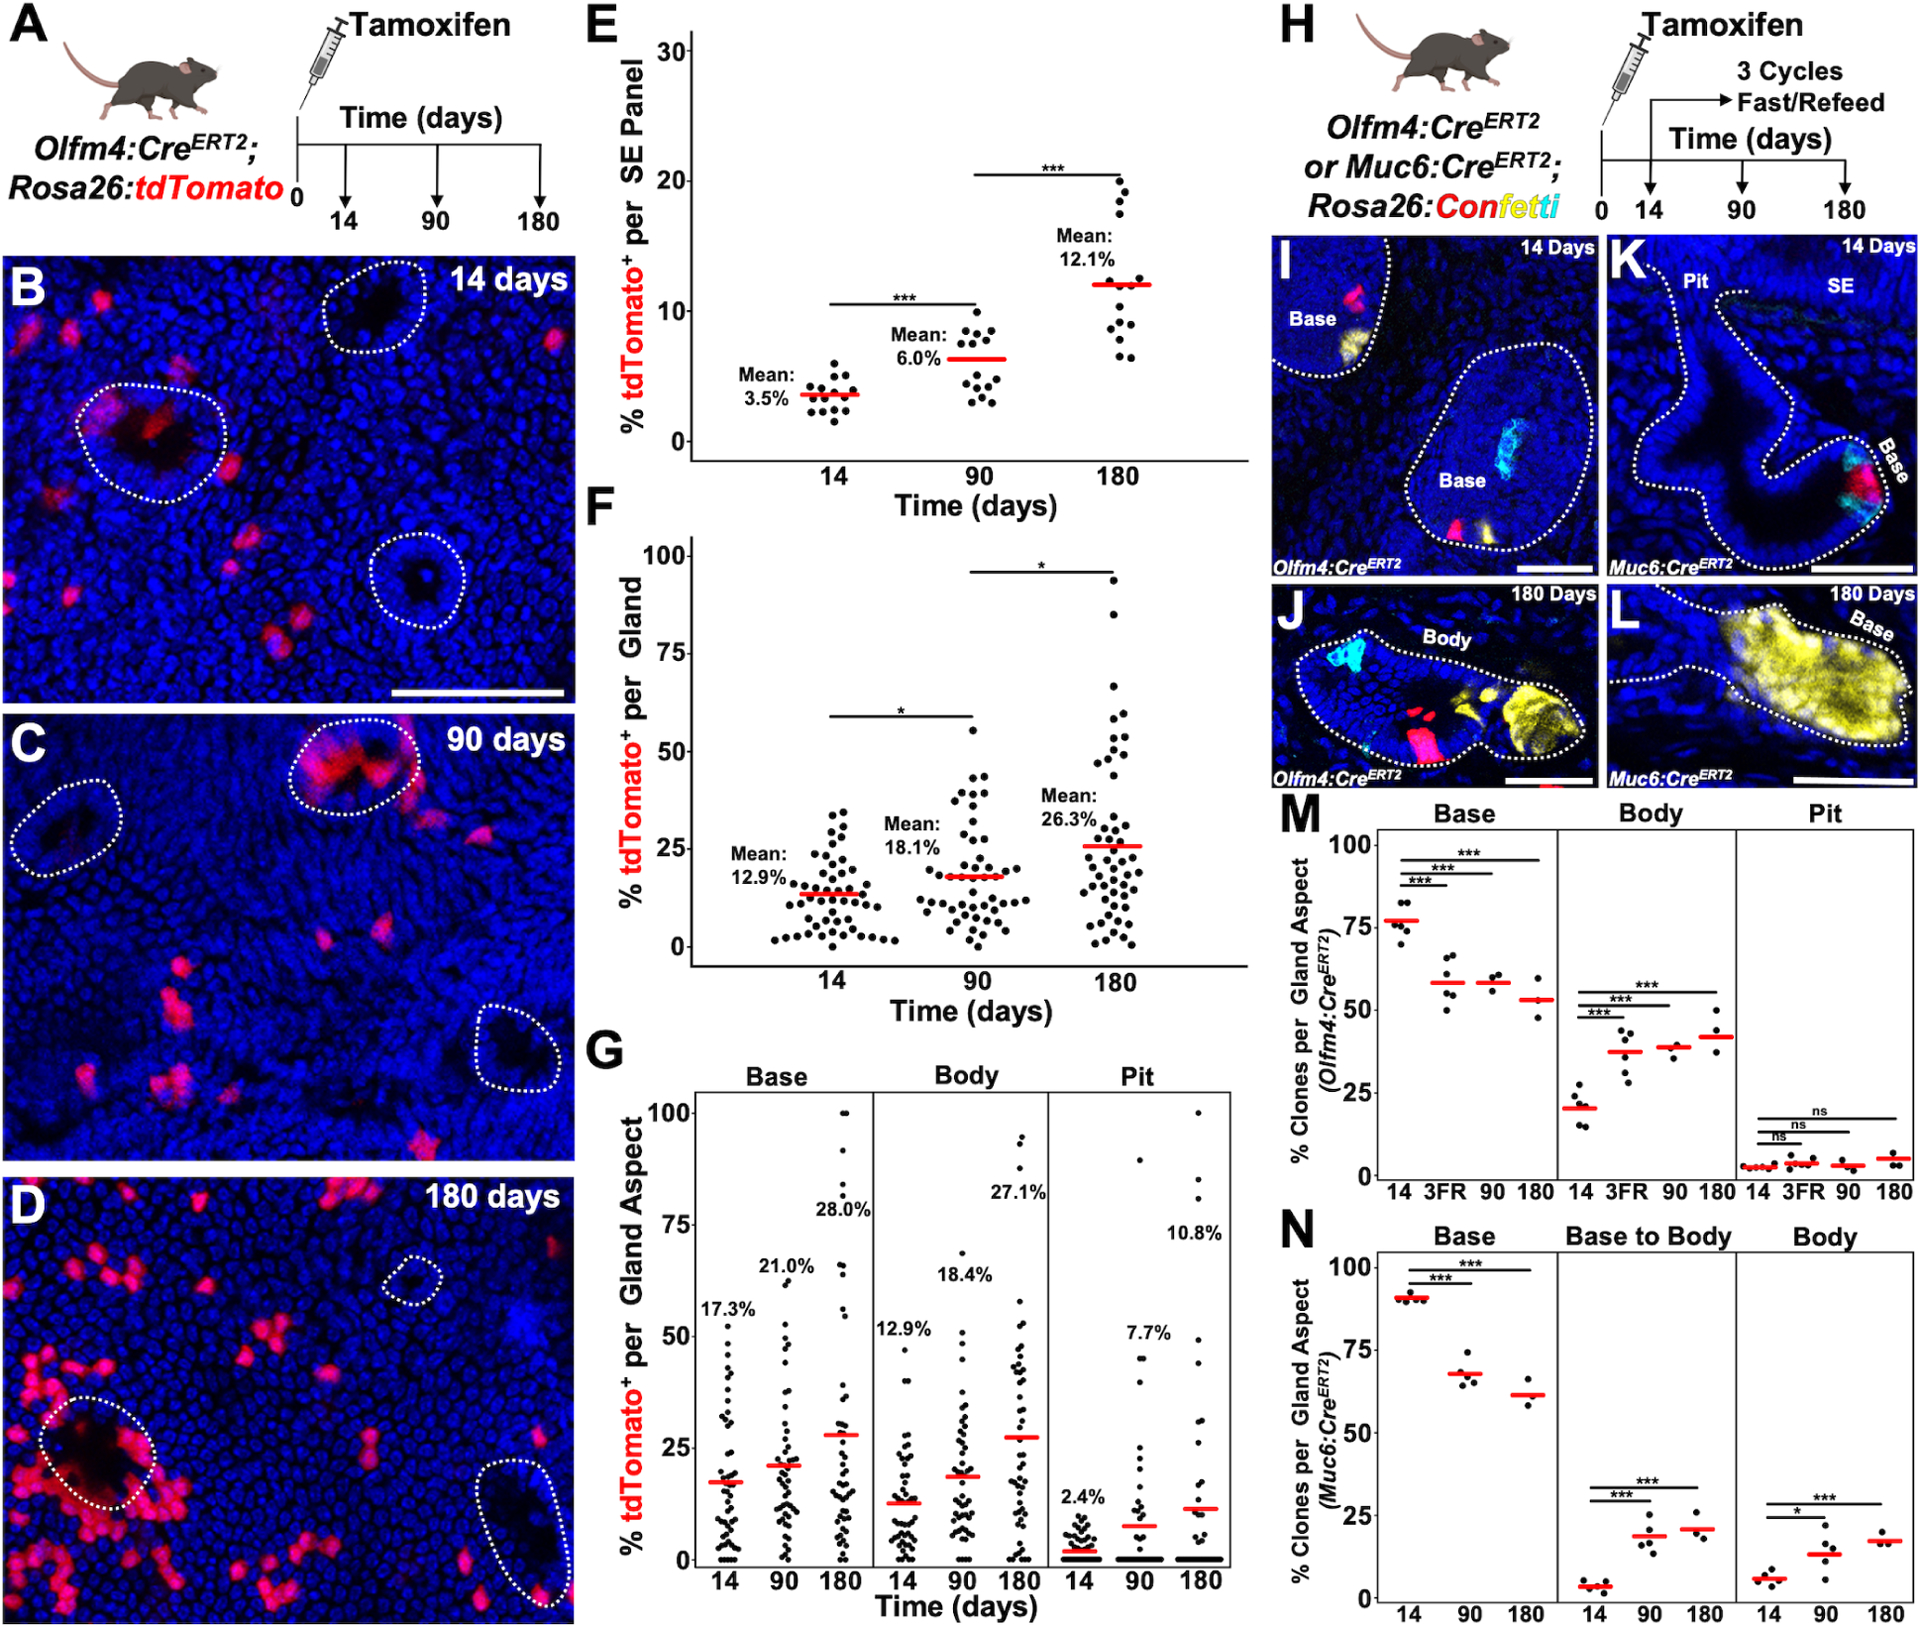
Figure 6. Peribiliary Base Directed Lineage Tracing.

(A) Schematic of experimental design. (B-D) Surface epithelial panels from 14 (B), 90 (C) and 180 (D) days with peribiliary pits marked with dashed outlines. (E) Percent labeling of the surface epithelium from 5 low power panels (n = 3 animals per timepoint). (F) Percent labeling of peribiliary glands (50 total glands from n = 3 animals per timepoint). (G) Percent labeling of the gland base, body, and pit. (H) Schematic showing experimental design. (I) Image of the bases of outlined peribiliary glands 14 days after tamoxifen in a Olfm4:CreERT2; Rosa26:Confetti animal. (J) Example of a gland in which a small alveolus is clonally labeled. (K) Sectional view of a Muc6:CreERT2; Rosa26:Confetti gland 14 days post tamoxifen where recombined cells are only located at the base. (L) Example of a gland at 180 days after tamoxifen in which an alveolus is clonally labeled. (M and N) Quantification of the percent of clones found within a glandular compartment from Olfm4:CreERT2 (M) or Muc6:CreERT2 (N) (at least 50 clones per animal, n = 3–6 animals per timepoint). Scale bars, 50 μm. * p<0.05, *** p<0.001, ns = not significant, by Students t-test.
