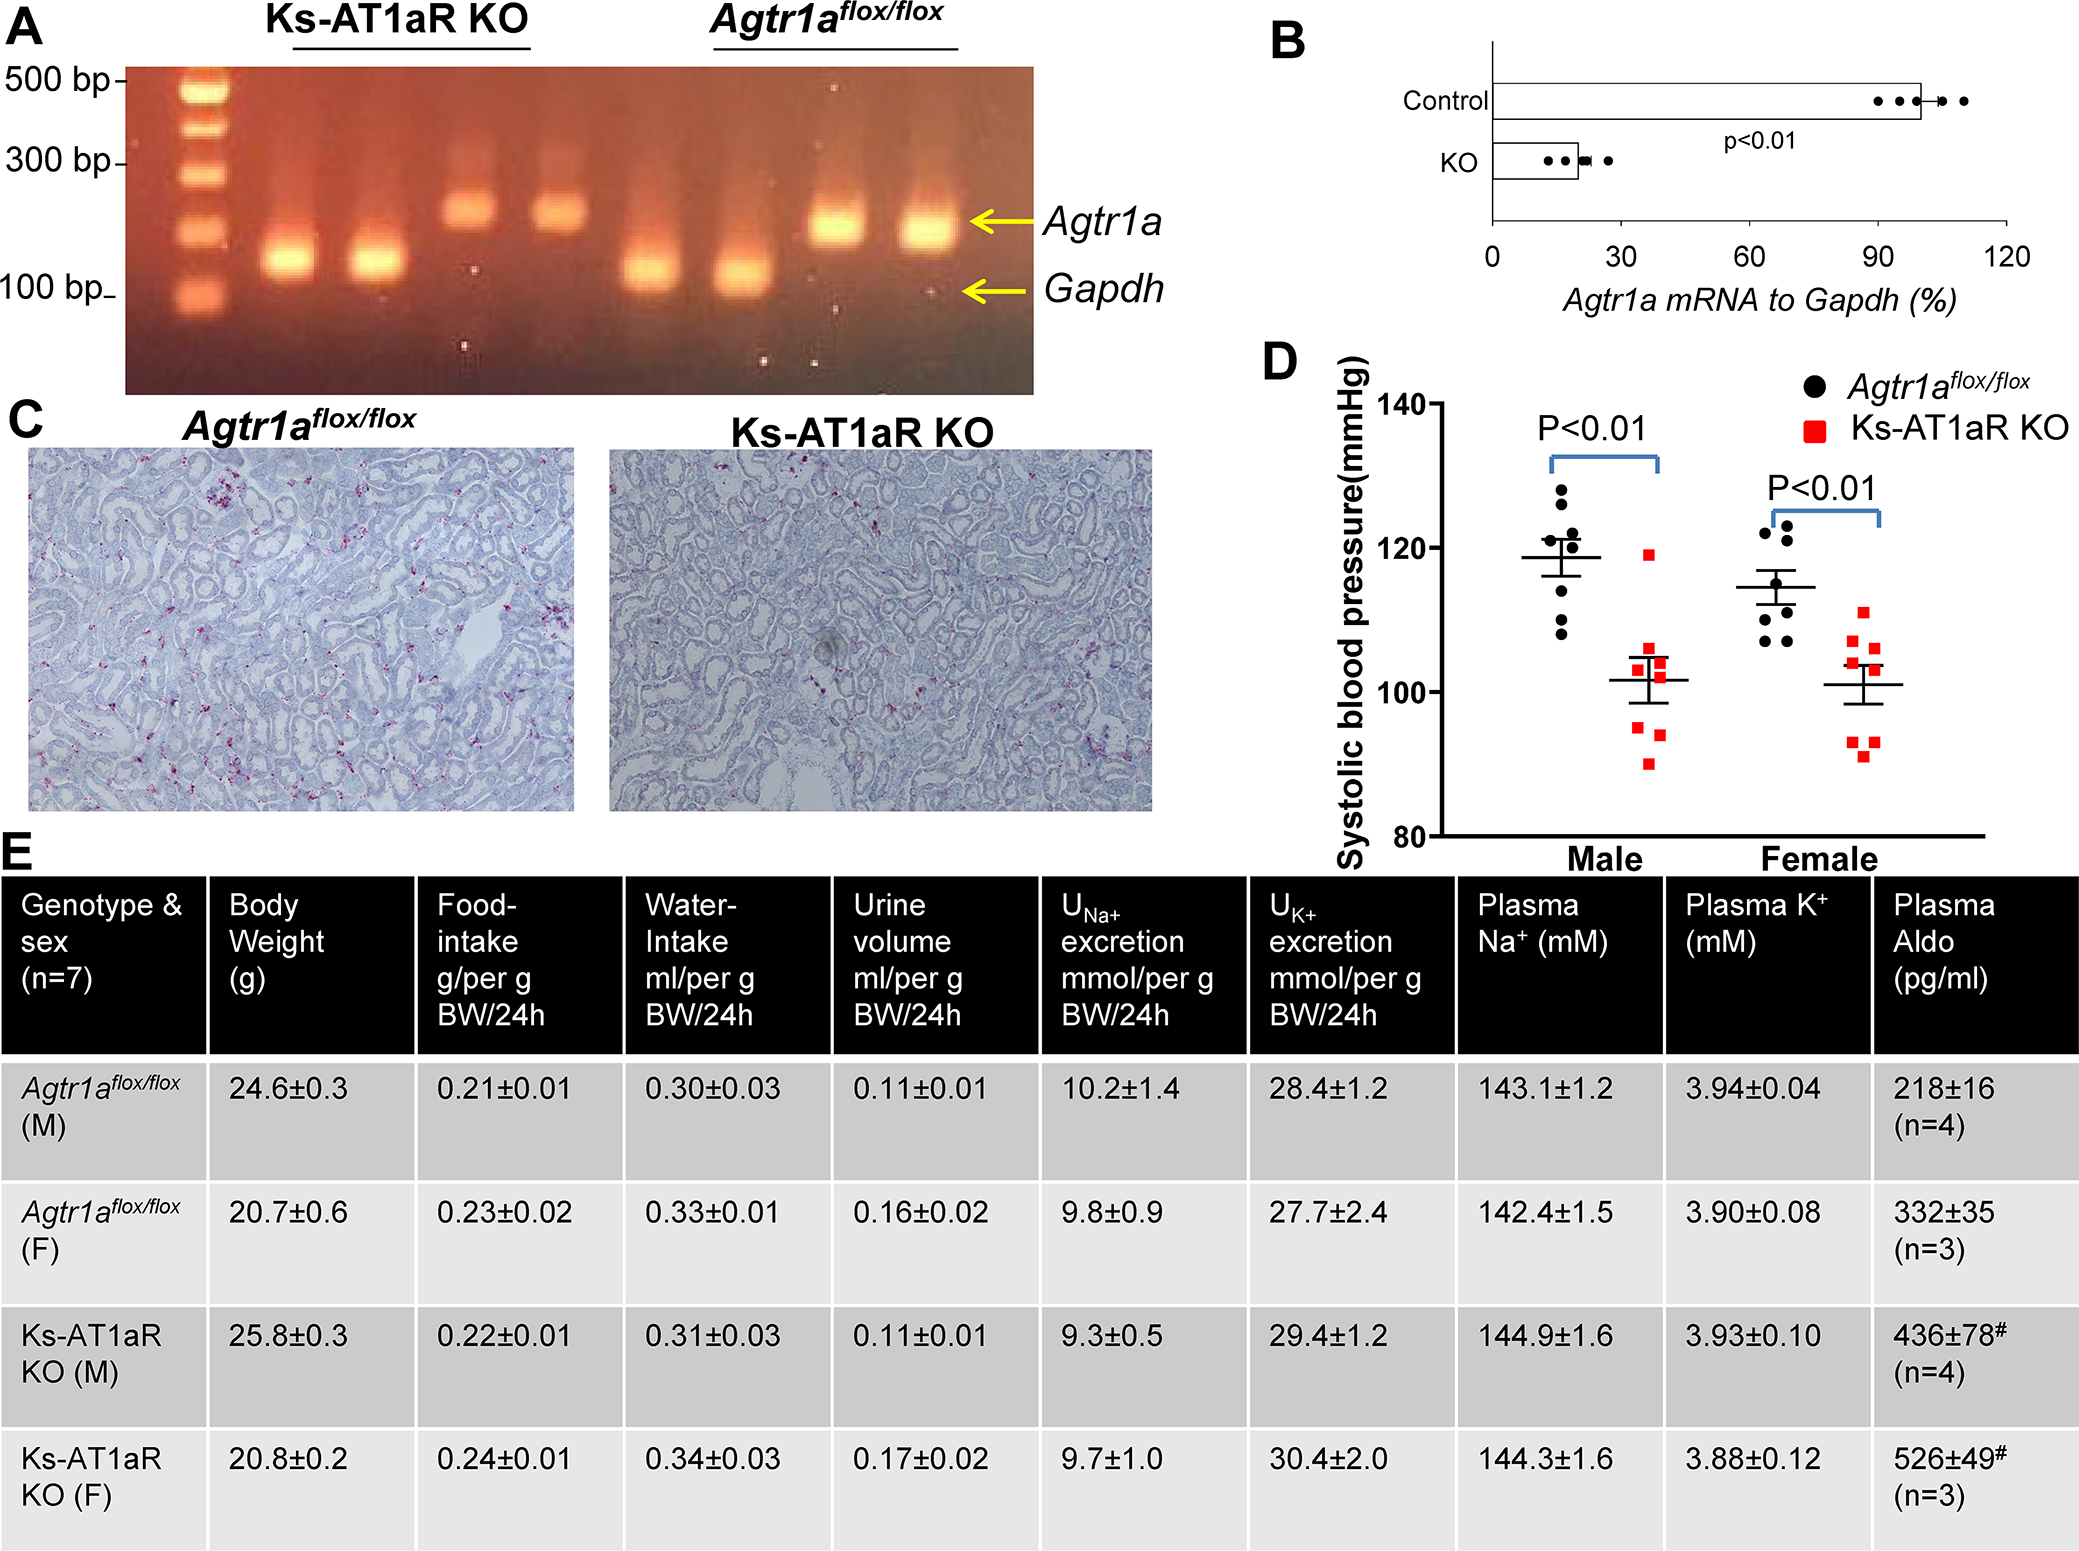
Fig. 1. Ks-AT1aR KO mice are hypotensive.

(A) An agarose gel shows the expression of Agtr1a mRNA expression level in Agtr1aflox/flox mice and in Ks-AT1aR KO mice. The mRNA was isolated from renal cortex tissue and was subjected to reverse transcription. (B) A scatter plot showing the expression of Agtr1a mRNA to Gapdh mRNA from Ks-AT1aR KO mice in comparison to Agtr1aflox/flox mice. Significance is determined by an unpaired t test. (C) Images show Agtr1a mRNA expression (red dots) in Agtr1aflox/flox and Ks-AT1aR-KO mice. Hybridization signaling are detected using fast-red staining. (D) A scatter plot shows each measurement and mean value ± SEM of systolic blood pressure measured with tail-cuff method in male/female Ks-AT1aR KO mice and Agtr1aflox/flox mice. Significance is determined by two-way ANOVA. (E) A table shows the baseline characterization of mouse phenotypes in Ks-AT1aR KO mice and Agtr1aflox/flox mice. # indicates a significant difference in comparison to the corresponding control.
