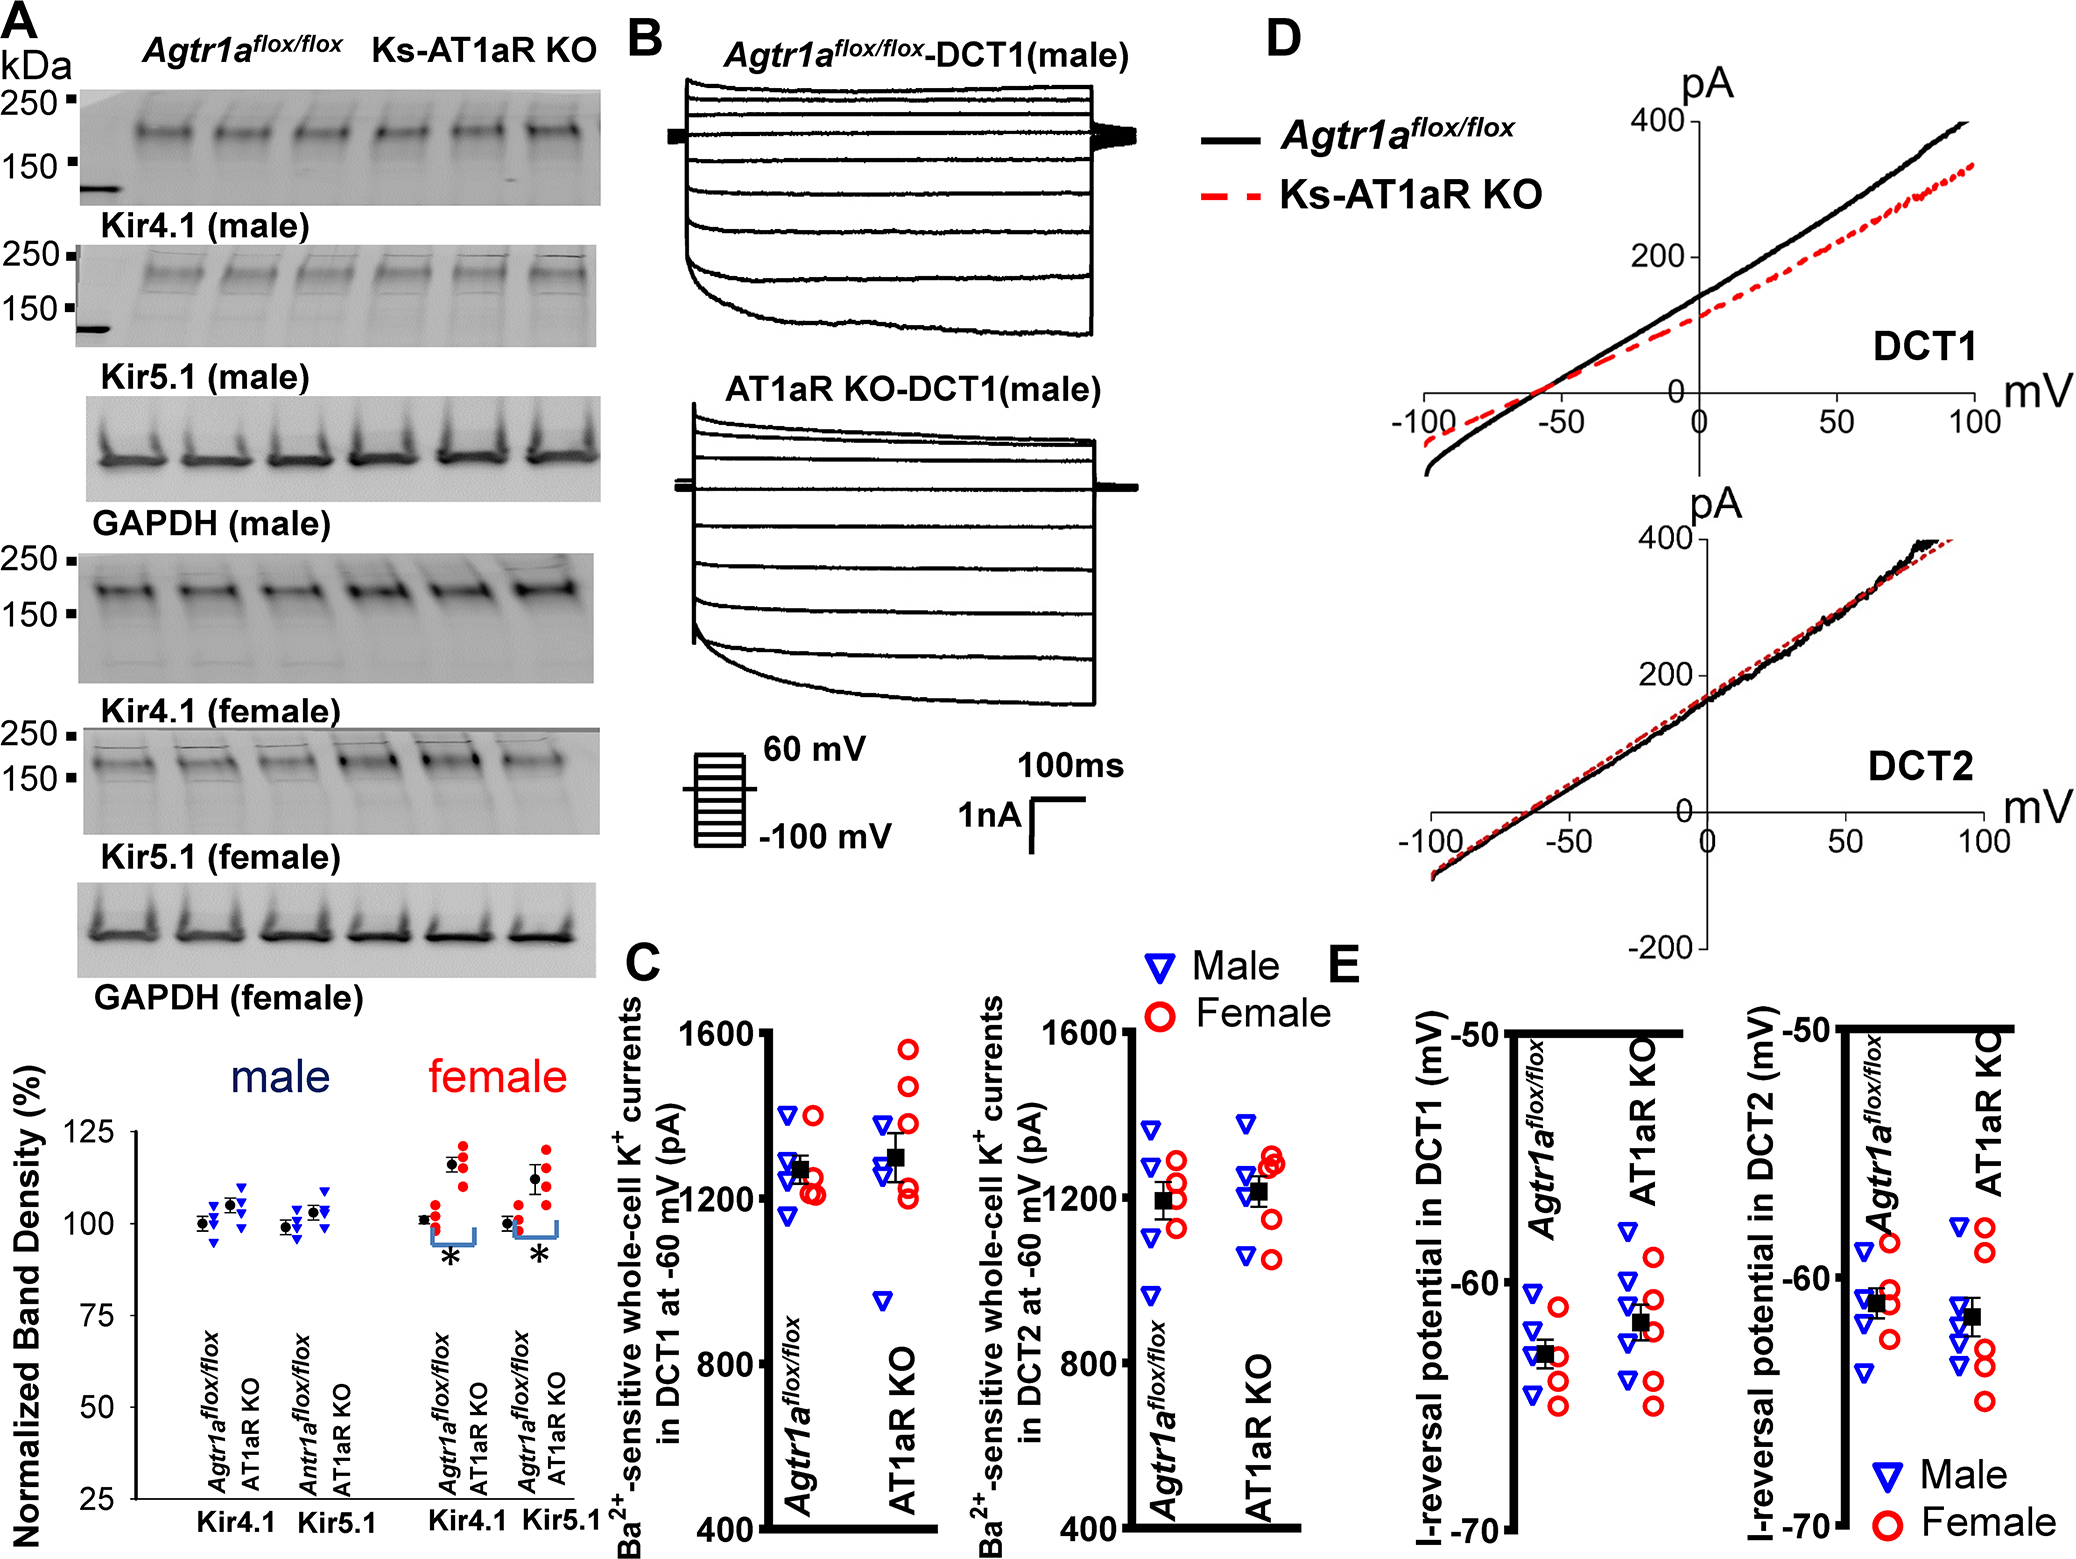
Fig. 3. Deletion of AT1aR did not affect Kir4.1/Kir5.1-heterotetramer activity.

(A) A set of western blot shows the expression of Kir4.1, Kir5.1 and GAPDH in male/female Ks-AT1aR KO mice and Agtr1aflox/flox mice. A scatter plot in the bottom panel summarizes mean value (at the left column) and each data point of the normalized band density for male (blue triangle)/ female mice (red circle) in AT1aR KO mice and Agtr1aflox/flox mice. (B) Two traces show Ba2+-sensitive Kir4.1/Kir5.1-mediated K+ currents measured with whole-cell-recording with step-protocol from −100 to 60 mV in DCT1 of male AT1aR KO mice and Agtr1aflox/flox mice. (C) Two scatter plots summarize the experiments in which the whole-cell Ba2+-sensitive Kir4.1/Kir5.1-mediated-K+ currents were measured at −60 mV in the DCT1 and DCT2, respectively. Blue triangle and red circle represent each data point measured at male and female mice, respectively. The mean value of each group is shown in the middle (including both genders). (D) A set of traces show I-reversal potential measured with whole-cell voltage-clamp from −100 to 100 mV in DCT1 and DCT2 of male AT1aR KO (red) and Agtr1aflox/flox mice (black). (E) Two scatter plots summarize the experiments in which I-reversal potential was measured in DCT1 and DCT2 of male (blue triangle) and female (red circle) AT1aR KO mice and Agtr1aflox/flox mice. The mean value of each group is shown in the middle (including both genders).
