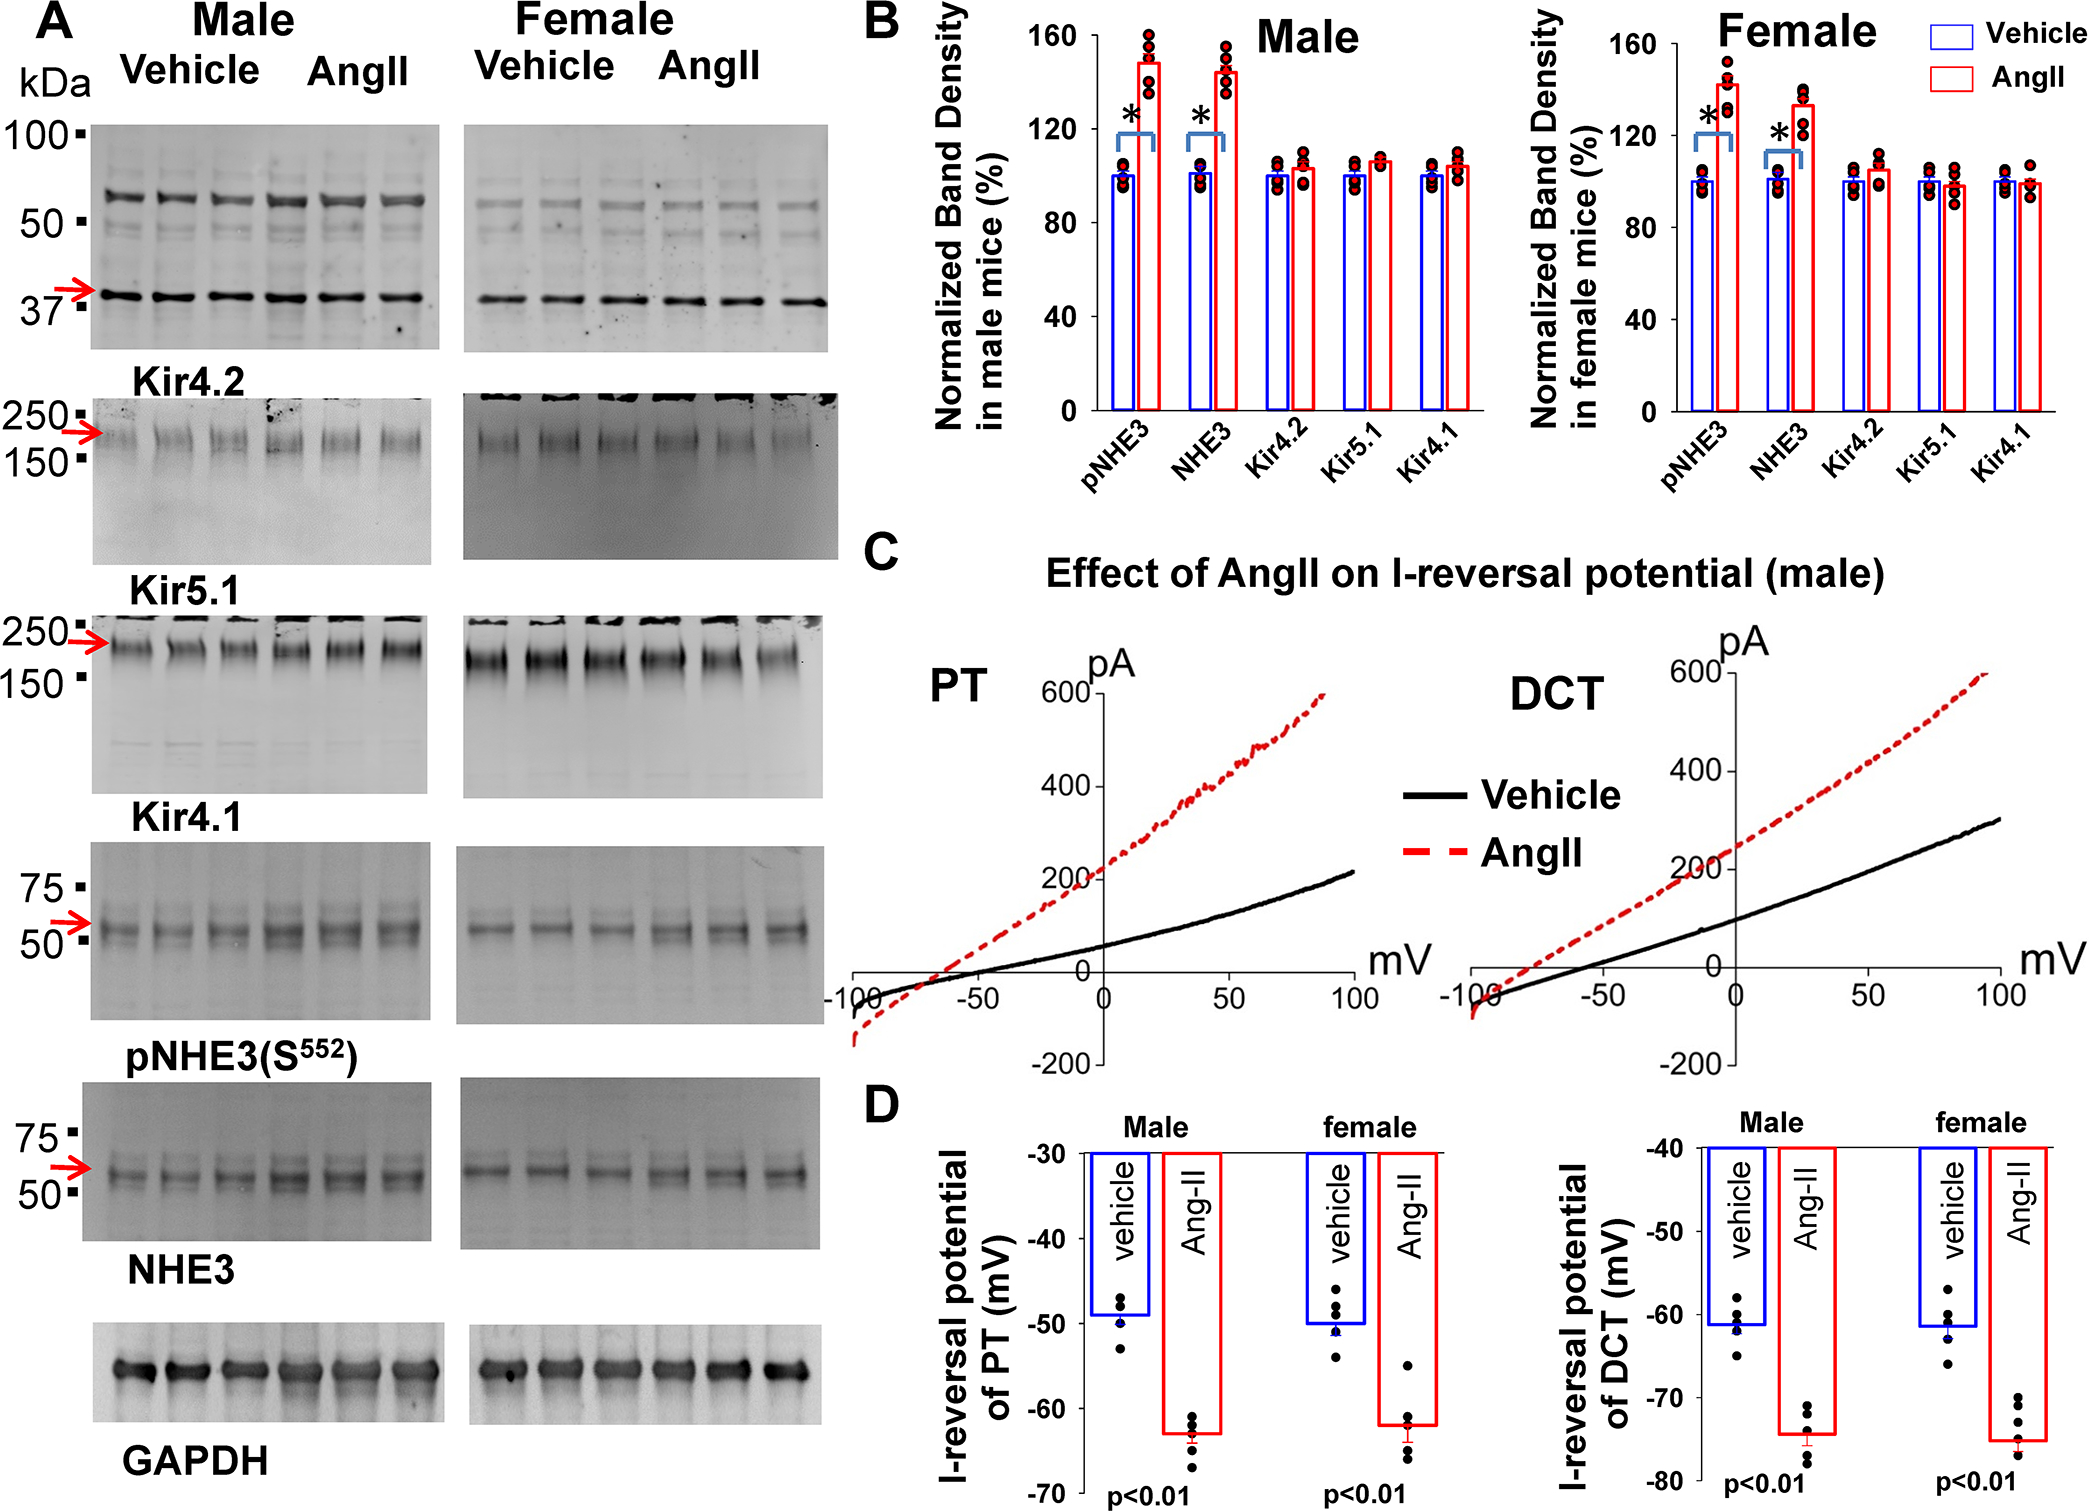
Fig.4. Chronic Angiotensin-II perfusion hyperpolarizes PT and DCT membrane.

(A) A set of western blot shows the expression of Kir4.2, Kir4.1, Kir5.1, pNHE3 (S552), total NHE3 and GAPDH in male and female control mice treated with angiotensin-II for 7 days (at 200 ng/min/ Kg) through an osmotic pump. An arrow indicates the band used for calculating normalized-band-density. (B) A bar graph with a scatter plot summarizes mean value and each data point of the normalized band density for male/female control mice treated with vehicle (blue bar) and angiotensin-II (red bar). The significance is determined by an unpair t test. (C) ) A set of I-reversal potential traces measured with whole-cell voltage clamp from −100 to 100 mV in the PT and DCT1 of male control mice treated with angiotensin-II for 7 days (red) and vehicle (black), respectively. (D) A bar graph with a scatter plot summarizes the results of experiments in which I-reversal potentials were measured in the PT and DCT1 of m/f control mice treated with vehicle (blue) and angiotensin-II (red). Significance is determined by two-way ANOVA.
