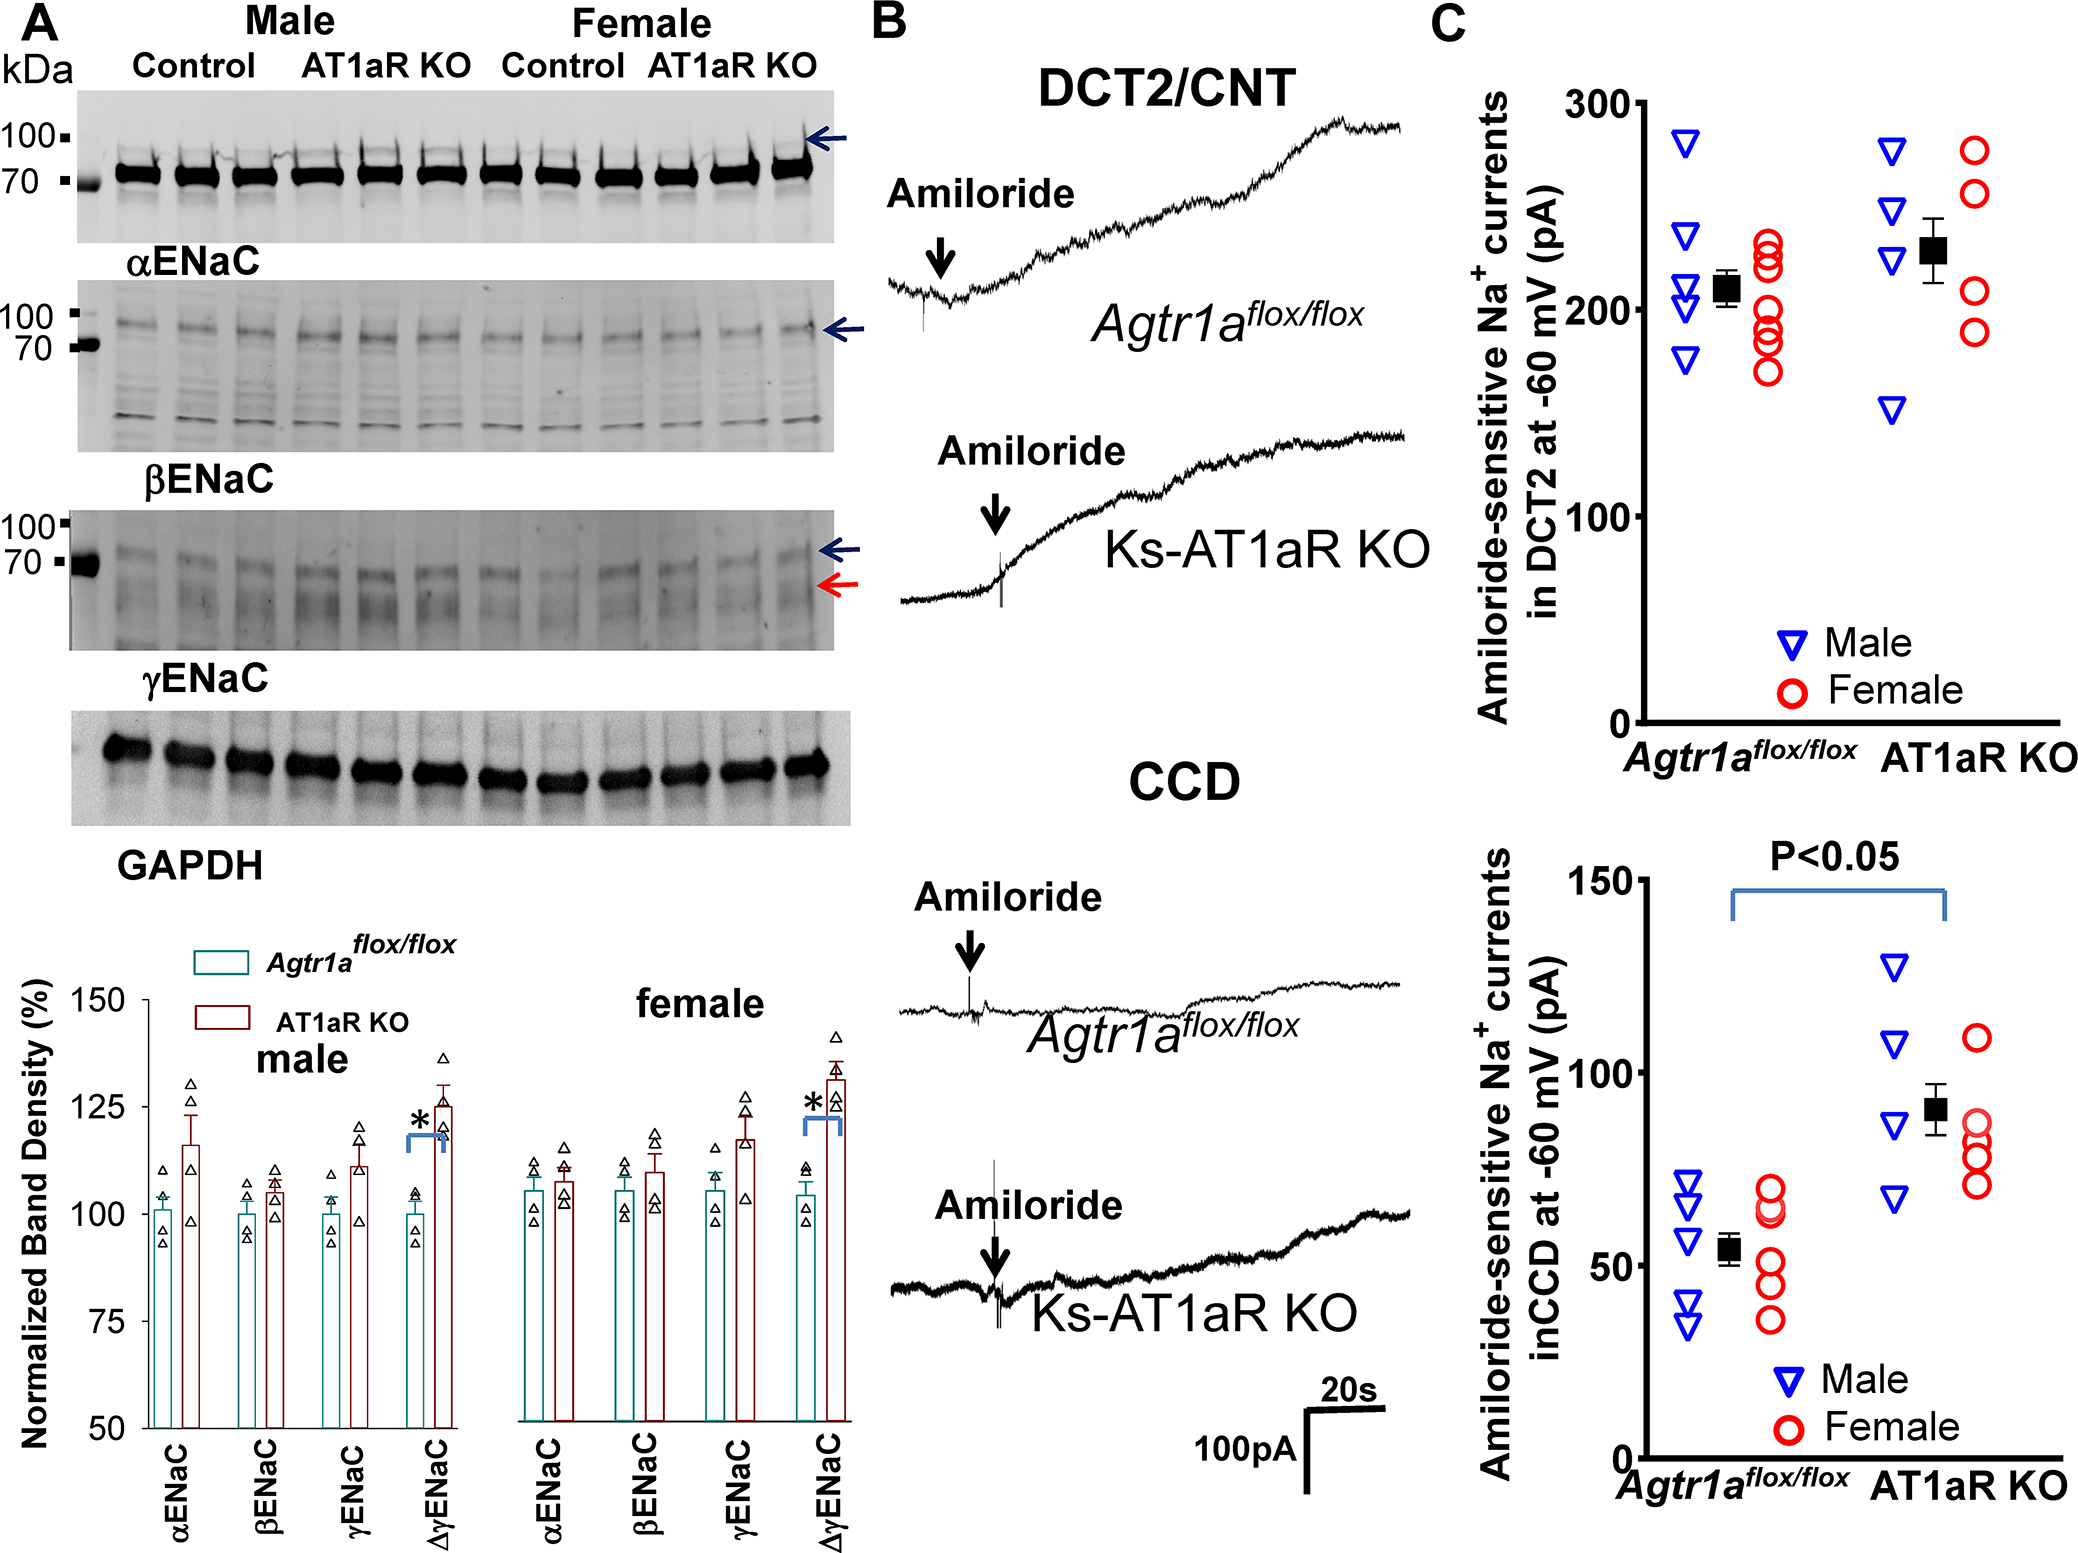
Fig.6. Deletion of AT1aR slightly stimulates ENaC in the CCD.

(A) A set of western blot shows the expression of αENaC, βENaC, γENaC, cleaved γENaC (indicated by a red arrow) and GAPDH in m/f Ks-AT1aR KO mice and Agtr1aflox/flox mice. The normalized band density of ENaC expression (The band used to calculate the normalized band density is indicated by arrows) is summarized in a bar graph with a scatter plot (bottom panel). Since the band which has higher molecular weight than the main band has been shown to be aldosterone-sensitive 50, this band was used to calculate αENaC density. (B) A set of whole-cell recordings shows amiloride-sensitive Na+ currents (ENaC) measured with gap-free-protocol at −60 mV in the DCT2/CNT and CCD of the control and Ks-AT1aR KO mice. (C) A set of scatter plots summarizes the results of amiloride-sensitive ENaC currents measured at −60 mV in the DCT2/CNT and in the CCD of male (Blue triangle)/female (red circle) control and Ks-AT1aR KO mice, respectively. The mean value of each group is shown in the middle (including male and female). Significance is determined by unpaired t test.
