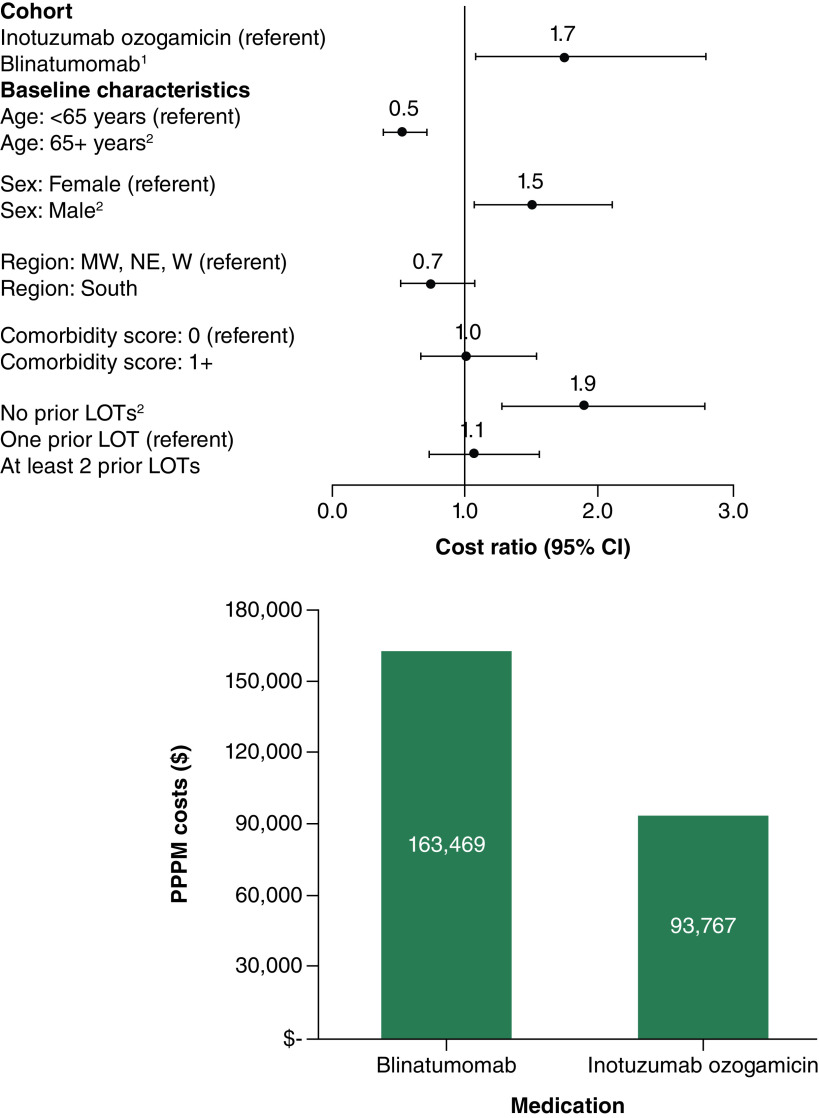
Figure 3. . Multivariable-adjusted cost ratios and predicted per-patient-per-month total acute lymphoblastic leukemia-related healthcare costs in the first relapse/refractory setting for blinatumomab (n = 29) and inotuzumab ozogamicin (n = 23).
1Differences in predicted costs for InO and Blina were statistically significant (p = 0.021).
2Cost ratio was statistically significant at alpha = 0.01.
Pearson chi-square = 18.628, degrees of freedom = 44; Specification link test p-value = 0.159; Park test estimate = 2.824, gamma distribution p-value = 0.163; Robust standard errors were calculated.
LOT: Line of therapy; MW: Midwest; NE: Northeast; PPPM: Per-patient-per-month; W: West.

