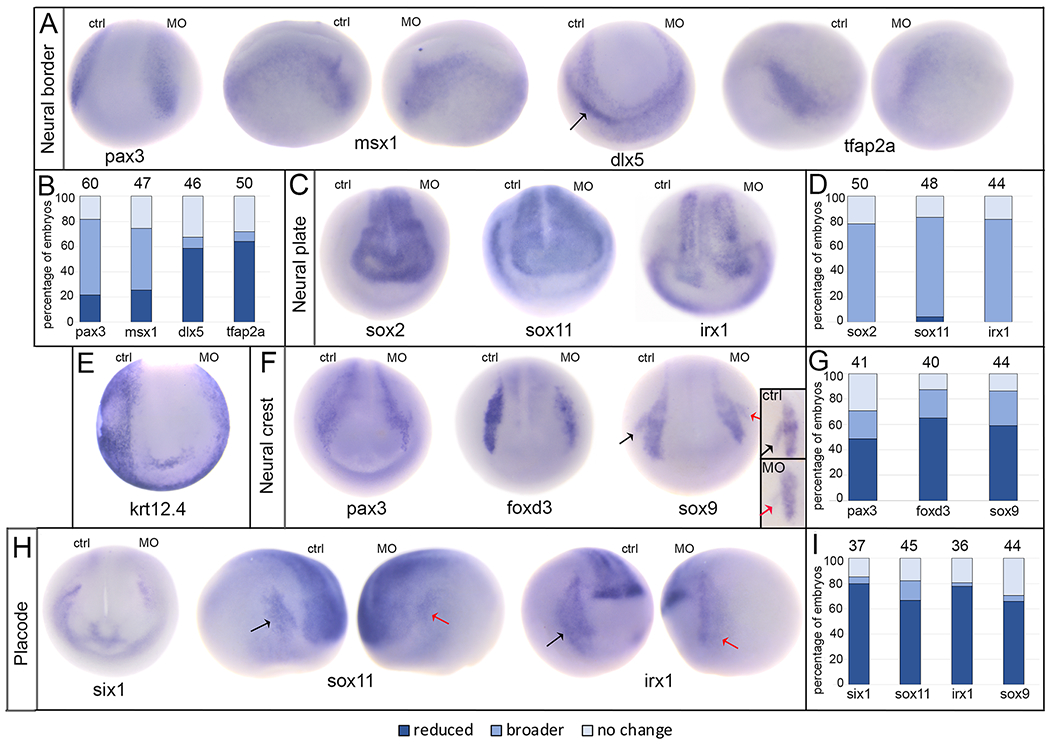
Figure 4:

Loss of endogenous XB5850668.L alters gene expression in each ectodermal domain.
A: The expression domains of neural border genes were differentially affected by loss of XB5850668.L. Those associated later in development with the lateral neural plate and neural crest (pax3, anterior view; msx1, side views) were predominantly broader on the MO side of the embryo compared to the control side (ctrl) of the same embryo. Those associated later in development with epidermis and PPE (dlx5, anterior view; tfap2a, side views) were predominantly reduced in size and intensity on the MO side of the embryo compared to the control side (ctrl) of the same embryo. Arrow in dlx5 embryo points out the major domain (on the control side) that was analyzed. Dorsal is to the top of each image.
B: Percentage of embryos in which neural border gene expression domains were reduced in size (dark blue), broader (medium blue), or did not change (light blue) when analyzed at the end of gastrulation (st 13). The number of embryos analyzed for each gene is at the top of each bar.
C: The expression domains of three neural plate genes (sox2, sox11, irx1) were broader upon loss of XB5850668.L (MO) compared to the control side (ctrl) of the same embryo. Anterior views with dorsal to the top.
D: Percentage of embryos in which neural plate expression domains were reduced in size (dark blue), broader (medium blue) or did not change (light blue) when analyzed at neural plate stages (st 16-18). The number of embryos analyzed for each gene is at the top of each bar.
E: The expression domain of epidermis-specific keratin (krt12.4) was reduced, i.e., further from the midline, on the MO side of the embryo (95.45%, n=22). Anterior view with dorsal to the top.
F: The expression domains of three genes associated with neural crest (pax3, foxd3, sox9) were predominantly reduced in size on the XB5850668.L MO side of the embryo compared to the control side (ctrl) of the same embryo. For pax3, the most noticeable staining at this stage was in the hatching gland precursors. The black arrow on the sox9 embryo denotes the control otic placode domain and the red arrow denotes the otic placode domain on the MO side. Anterior views with dorsal to the top. Inset shows sox9 otic placode expression in a different embryo, demonstrating a reduced domain on the MO side (red arrow) compared to control side (black arrow). Lateral views with dorsal to the top.
G: Percentage of embryos in which neural crest expression domains were reduced (dark blue), broader (medium blue) or did not change (light blue) when analyzed at neural plate stages (st 16-18). The number of embryos analyzed for each gene is at the top of each bar.
H: The expression domains of three PPE genes (six1, anterior view; sox11, side views; irx1, side views) were reduced on the XB5850668.L MO side of the embryo compared to the control side (ctrl) of the same embryo. For sox11 and irx1, the black arrows denote the control PPE domain and the red arrows denote the PPE domain on the MO side. Dorsal is to the top of each image.
I: Percentage of embryos in which PPE expression domains were reduced (dark blue), broader (medium blue) or did not change (light blue) when analyzed at neural plate stages (st 16-18). The number of embryos analyzed for each gene is at the top of each bar.
