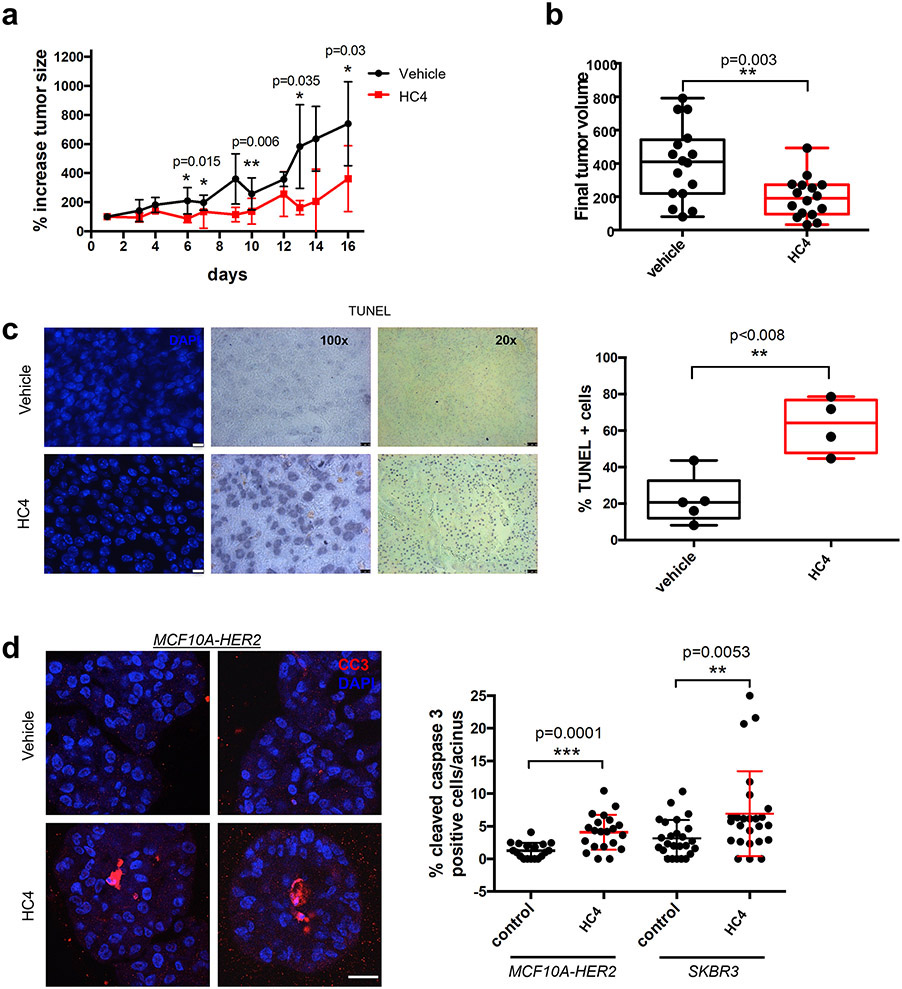
Figure 4. PERK inhibition impairs tumor growth in MMTV-HER2 females.
(a) MMTV- HER2 females (24- to 32-week-old) presenting overt tumors were injected daily with vehicle or HC4 (50 mpk) for 2 weeks. Percentage variation of tumor size in vehicle- and HC4-treated animals ± s.d. (N=16 per condition). P by Mann-Whitney test. (b) Final tumor volume (mm3). The whiskers represent the min and max of the data (N=16 per condition). P by Mann-Whitney test. (c) Representative IHC of TUNEL staining to measure apoptosis levels in tumor sections. Scale bars, 10 and 50 μm. Graph, percentage TUNEL positive cells in vehicle- and HC4-treated tumor sections (vehicle N=5, HC4 N=4). P by Mann-Whitney test. (d) HER2+ MCF10A-HER2 or SKBR3 cells were seeded on Matrigel and after acinus establishment (day 4) wells were treated with vehicle (control) or HC4 (2 μM) for 10 days. Representative confocal images of MCF10A-HER2 acini IF-stained for cleaved caspase-3. Scale bar 20 μm. Graph, percentage of cleaved caspase-3 positive cells per acini (MCF10A-HER2 N=20 per condition, SKBR3 control N=24, HC4 N=22) ± s.d. P by Student’s t test.

