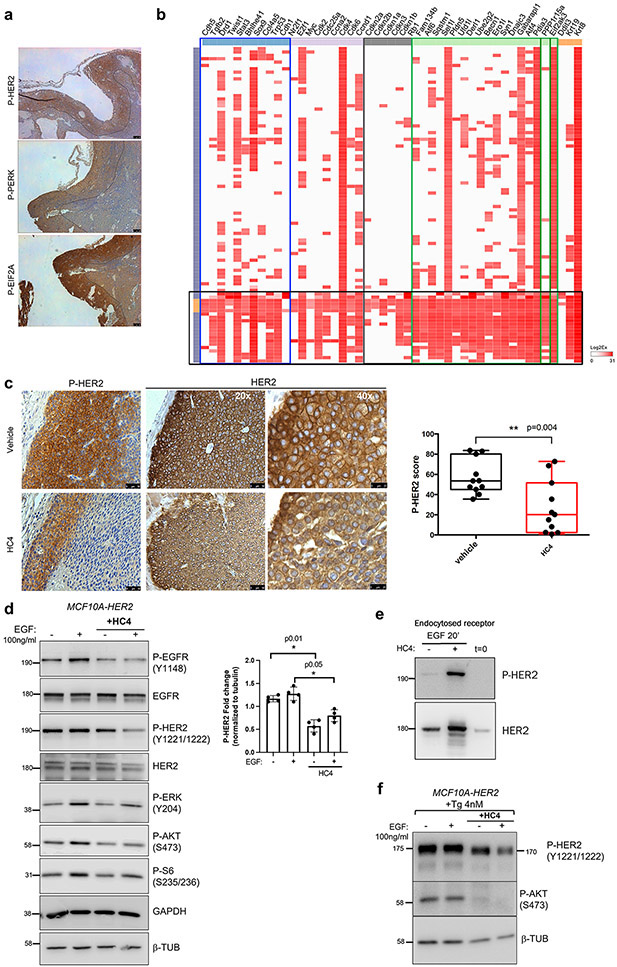
Figure 5. HC4 treatment decreases the levels of phospho-HER2 and downstream signaling pathways.
(a) Representative images of IHC for P-HER2, P-PERK and P-EIF2α in a MMTV-HER2 breast tumor section. Note that the rim positive for P-HER2 overlaps with P-PERK and P-EIF2α staining. Scale bar, 100 μm. (b) Hierarchical clustering of the high-throughput targeted-gene expression (columns) profile of single cells (primary breast tumor) (rows) from MMTV-HER2 females. Blue box, dormancy genes; grey box, cell cycle down genes; green box, ER stress genes and EIF2AK3 (PERK) gene; black box, population of primary tumor cells (around 25%) with high levels of ER stress genes expression (c) Representative P-HER2 and total HER2 IHC staining in vehicle- and HC4-treated breast tumors. Quantification of P-HER2 levels in tumor sections, by IHC intensity and area scoring (N=11 per condition) (See Supplementary Fig. S5a). Scale bar, 50 μm in 20X and 25 μm in 40X. P by Mann-Whitney test. (d) MCF10A-HER2 cells were starved o/n and treated +/−HC4 (2 μM), after which +/−EGF (100 ng/ml) was added for 15 min before collection. The levels of P-HER2, P-EGFR, P-AKT, P-S6 and P-ERK, as well as total HER2 and EGFR were assessed by Western blot. GAPDH and ß-tubulin were used as loading controls. Representative blot of three is shown. Densitometry analysis for P-HER2 (N=3) ± s.d. P by Student’s t test. (e) MCF10A-HER2 cells were treated as in (d) and reversible surface receptor biotinylation assay was performed. Endocytosed levels of total HER2 and P-HER2 were assessed. One of two experiments shown. (f) MCF10A-HER2 cells were treated as in (d) in presence of thapsigargin (4 nM). The levels of P-HER2 and P-AKT. ß-tubulin was used as loading control. Representative blot of three is shown.

