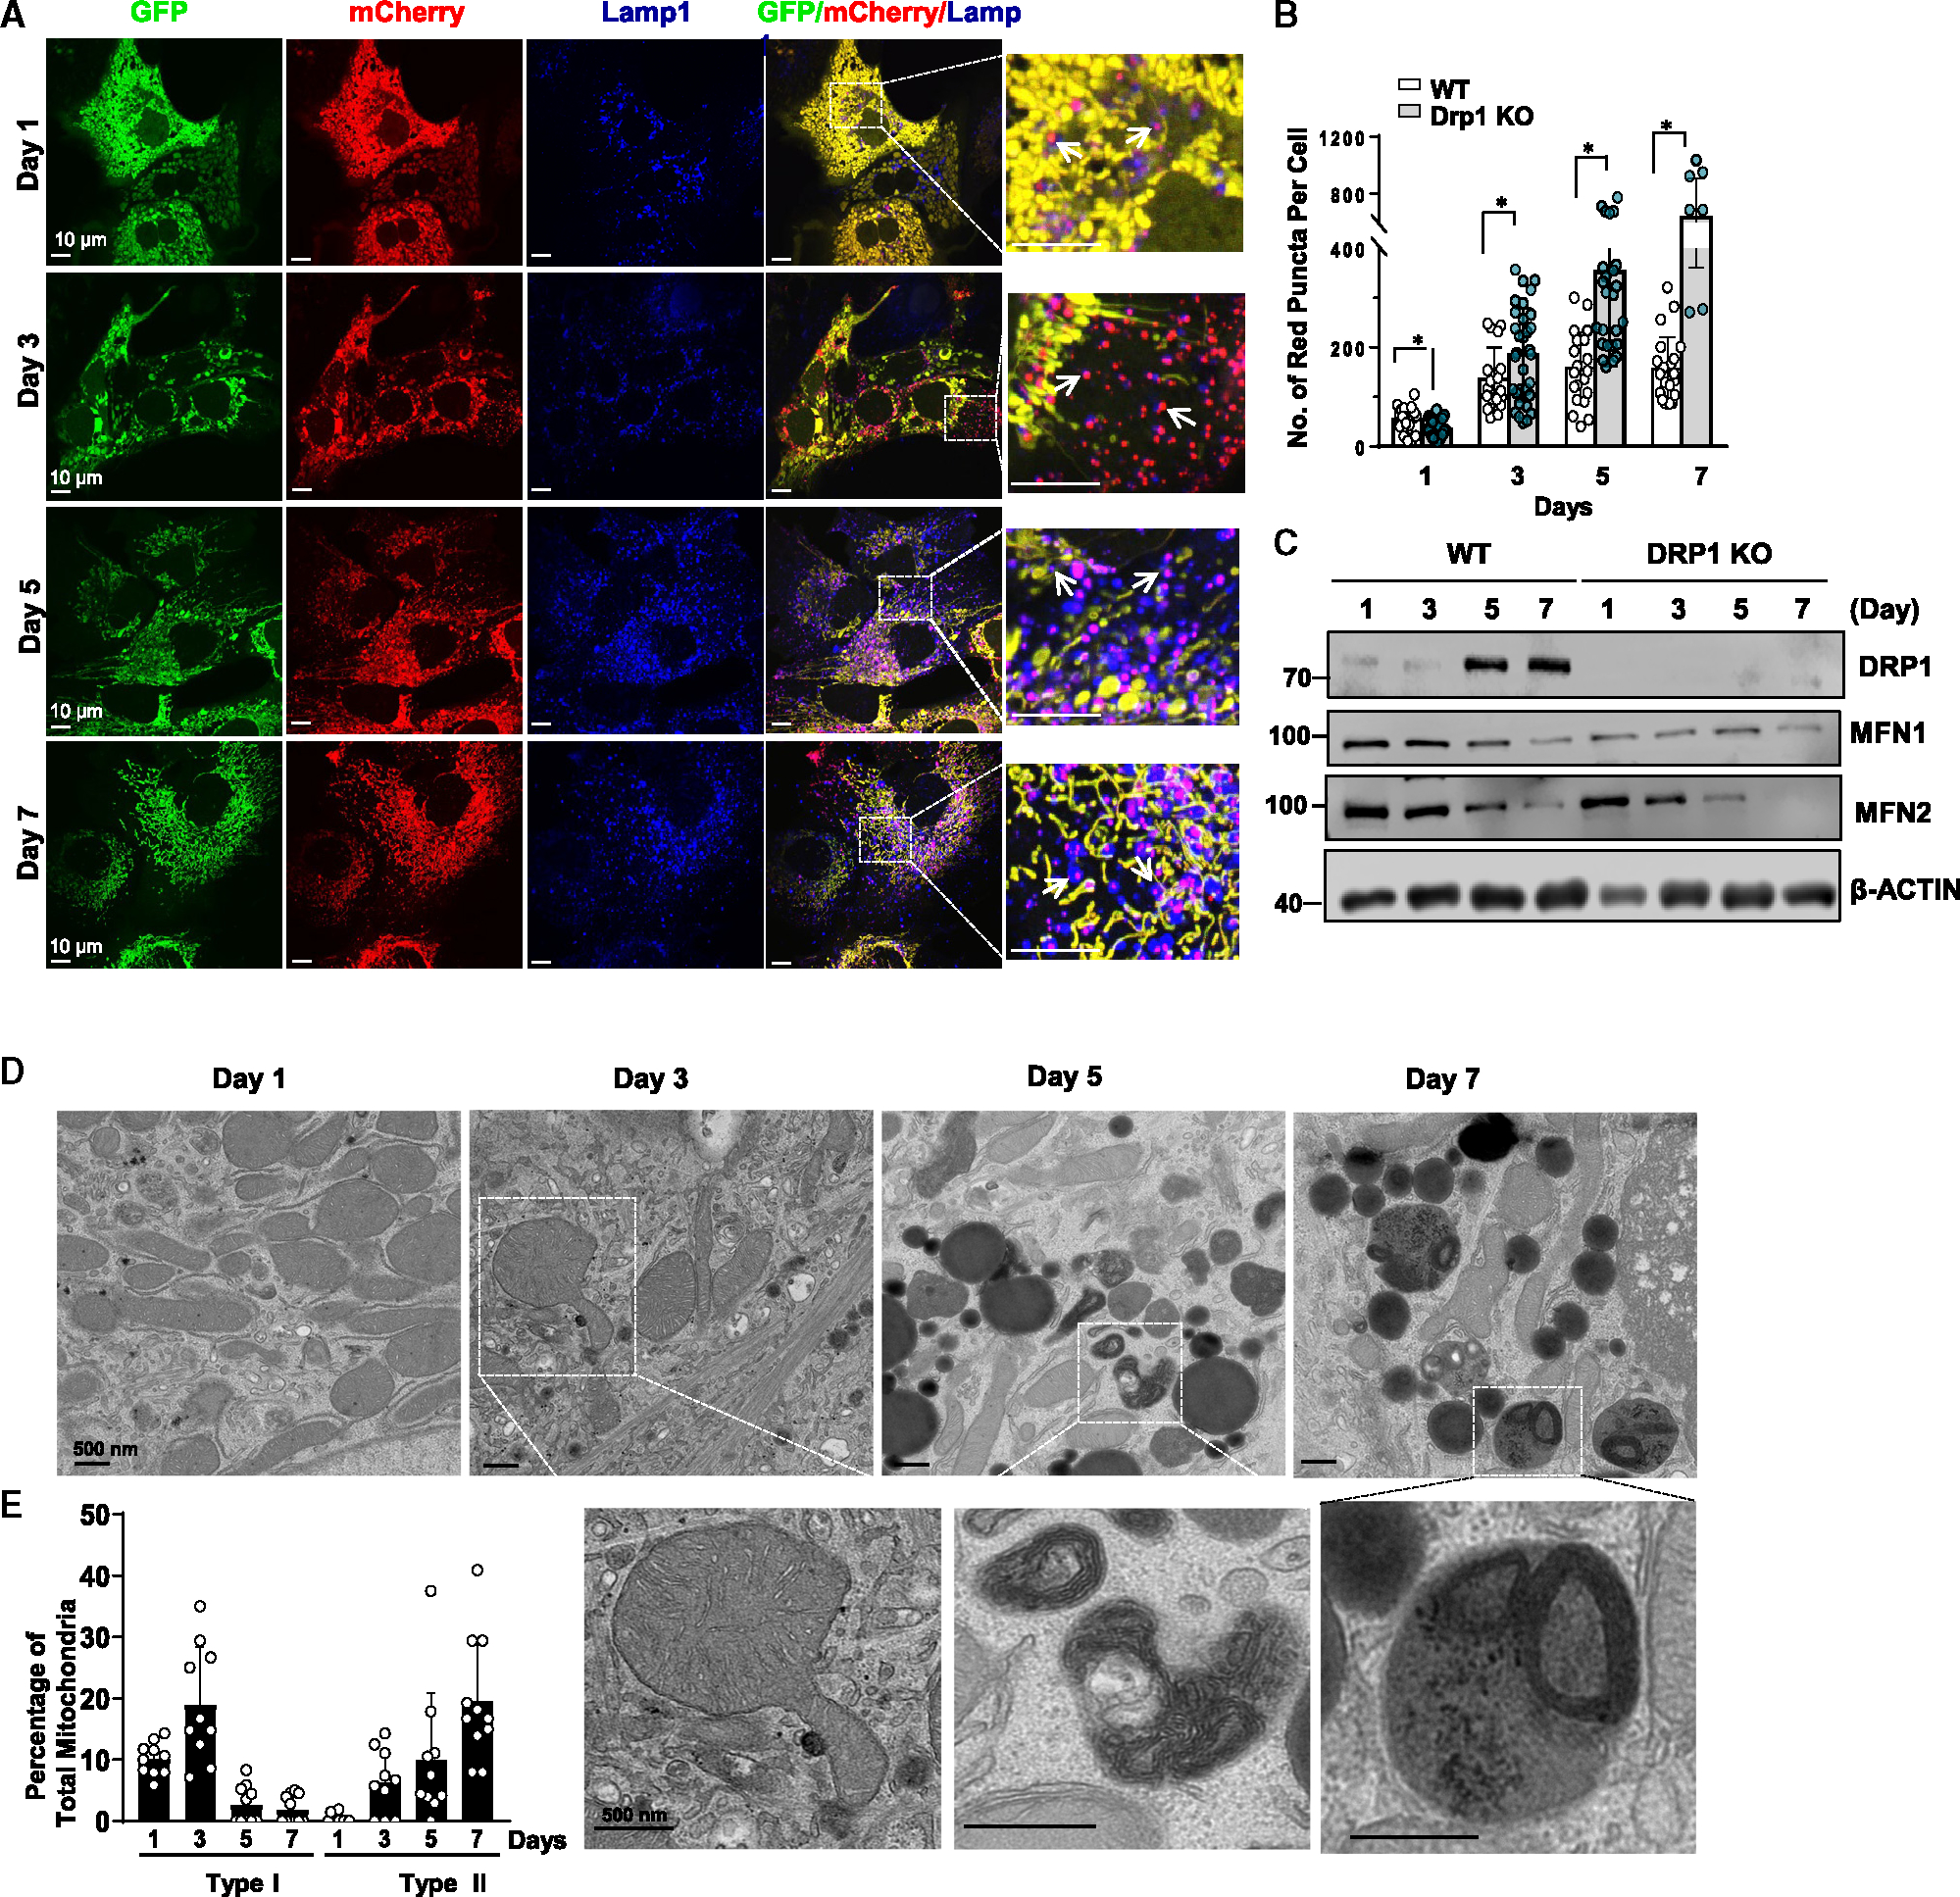
Figure 6. DRP1 is not required for the induction of MLRO in prolonged cultured mouse hepatocytes.

(A) DRP1 KO primary mouse hepatocytes were infected with adenovirus-COX8-GFP-mCherry (MOI = 10) from seeding for overnight. Cells grown on coverslips were fixed in 4% PFA at indicated time points followed by LAMP1 immunofluorescence staining. Representative images of confocal microscopy are shown. Arrows denote the colocalization of red-only mitochondria in COX8-GFP-mCherry assay with a lysosomal marker LAMP1.
(B) Quantification data for the number of red-only mitochondria in each cell from COX8-GFP-mCherry assay. Data are presented as mean ± SD. At least 15 fields from two independent mouse hepatocyte isolations were quantified.
(C) Total cell lysates were extracted from primary hepatocytes isolated from WT and liver-specific DRP1 KO mice that were cultured for indicated time points followed by western blot analysis.
(D) Representative TEM images from day 1 to day 7 cultured DRP1 KO mouse hepatocytes are shown.
(E) Type I and type II MLRO structures were quantified from (D) and normalized by the total mitochondria number in each field. *p < 0.05, two-tailed Student’s t test.
