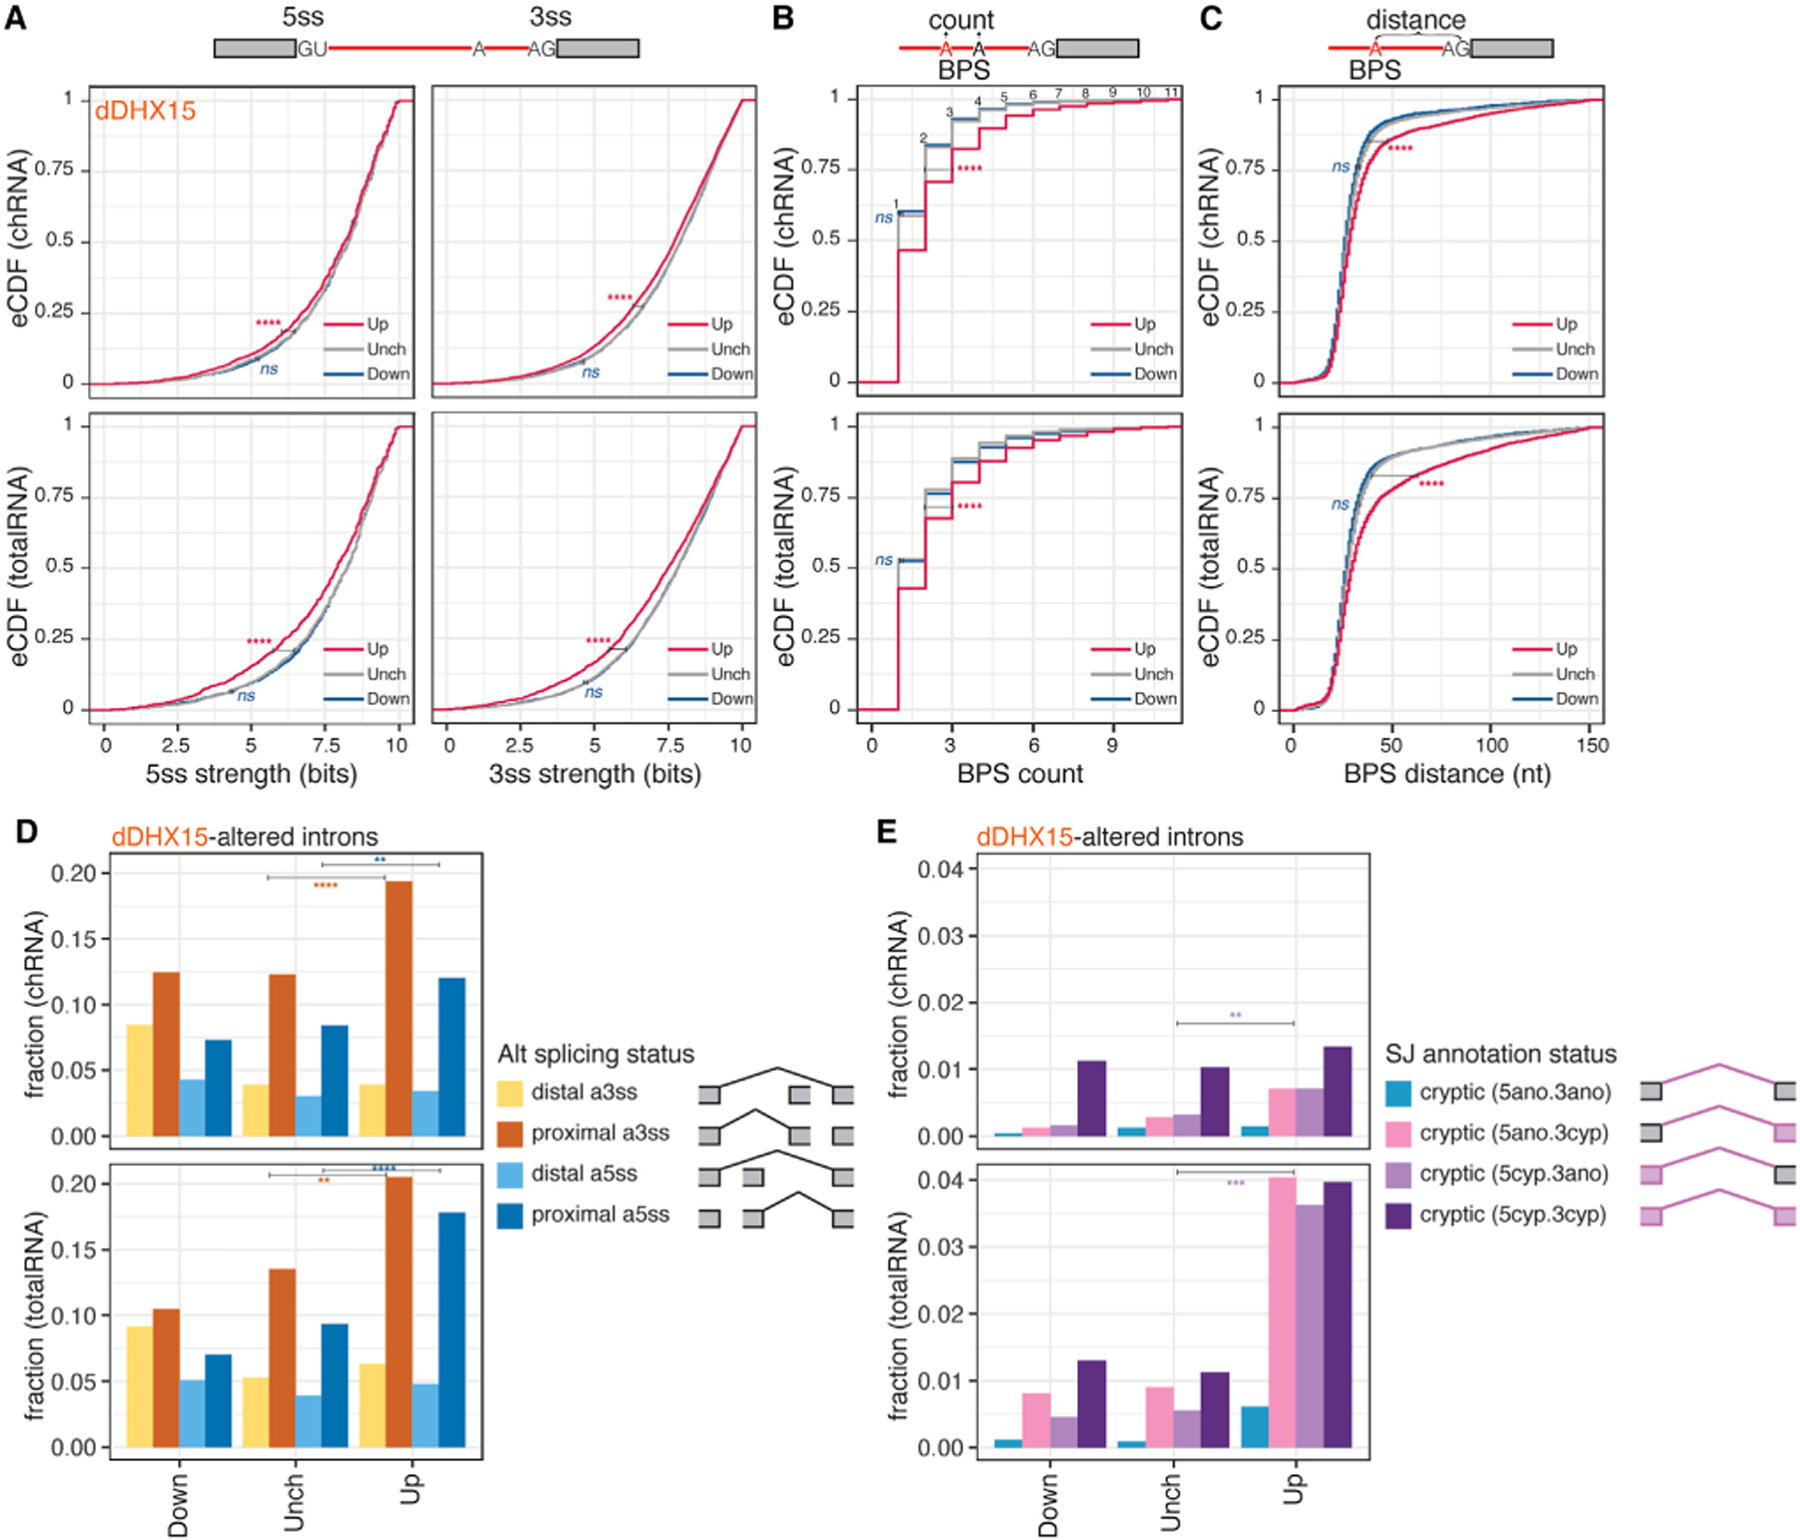
Figure 3. DHX15 represses the splicing of suboptimal and cryptic introns.

(A) eCDF of splice sites strength MaxEntScan scores. Magenta/navy (up/down), introns exhibiting significant (FDR ≤ 0.05) increases/decreases of SI ≥ 0.05 upon dTAG13-induced DHX15 depletion in HEK.dDHX15 cells; gray (Unch), introns exhibiting insignificant or unaltered changes in SI. 5ss, 5′ splice site; 3ss, 3′ splice site.
(B) Similar to (A), the distribution of counts of branchpoint site (BPS) per intron.
(C) Similar to (B), the distribution of distances between BPS and 3ss for each BPS-3ss pair. Statistical significance in (A)–(C) is calculated by Welch’s t test, indicated by asterisks ****p < 0.0001; ns, not significant) unless otherwise indicated.
(D and E) (D) Fraction of proximal versus distal alternative 3ss and 5ss usage and (E) fraction of cryptic splicing status in the down, up, or unchanged intron groups upon dTAG13-induced DHX15 depletion. SJ, splicing junction. Statistical significance in (D)–(E) is calculated by chi-squared test, indicated by asterisks (****p < 0.0001, ***p< 0.001, **p < 0.01) unless otherwise indicated. See also Figure S2.
