
Figure 1.
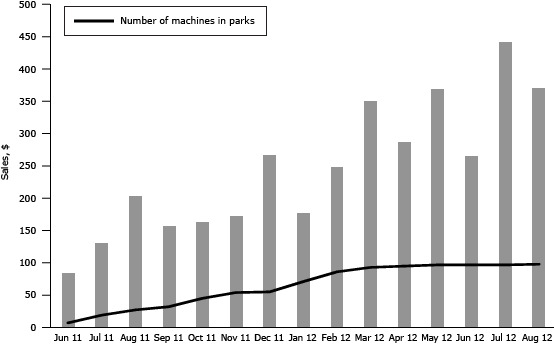
Average monthly sales per machine during the machine deployment period (June 2011 through August 2012).
| Month and Year | Sales by Month per Machine, $ | Number of Machines in Place |
|---|---|---|
| June 2011 | 84 | 7 |
| July 2011 | 131 | 19 |
| August 2011 | 204 | 27 |
| September 2011 | 157 | 32 |
| October-2011 | 163 | 45 |
| November 2011 | 173 | 54 |
| December 2011 | 268 | 55 |
| January 2012 | 177 | 71 |
| February 2012 | 249 | 86 |
| March 2012 | 351 | 93 |
| April 2012 | 288 | 95 |
| May 2012 | 370 | 97 |
| June 2012 | 266 | 97 |
| July 2012 | 443 | 97 |
| August 2012 | 371 | 98 |