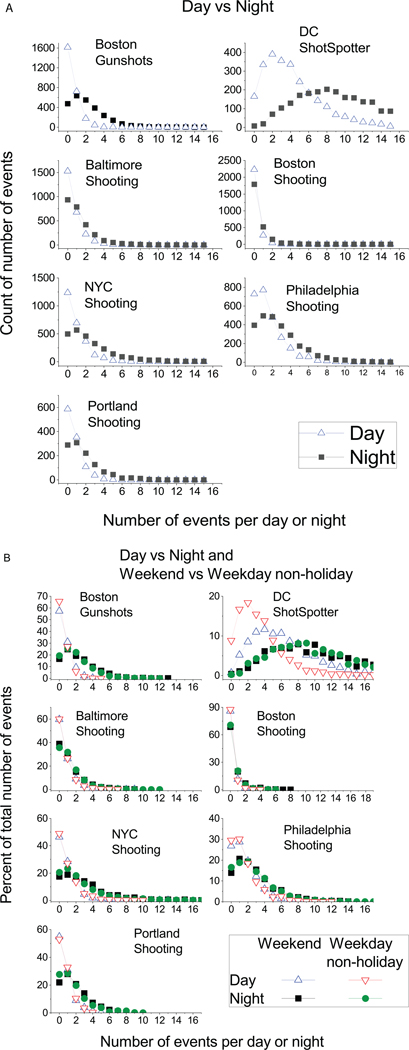
Figure 2.
Histograms of the number of gunshot events by city. the x-axis is the number of events per daytime or nighttime; y-axis is the number (panel a) or percentage (panel B) of times that number of events occurred. (a) number of gunshot events for each city by daytime vs nighttime by city (B) Percentage of gunshot events for each city by daytime vs nighttime and weekend vs weekday non-holiday. shooting gunshot events are those with victims. note: percentages are plotted in panel B because of the different number of days that are weekend vs weekday non-holiday.

