
Figure 1. CD44 and CD62L are progressively expressed on MBCs.
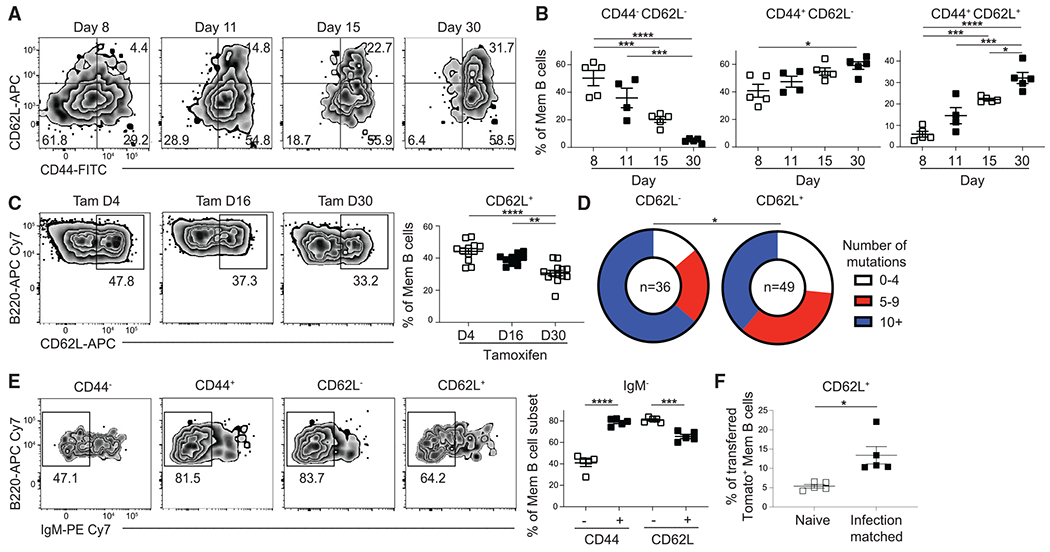
(A) Representative fluorescence-activated cell sorting (FACS) plots of the expression of CD44 and CD62L in splenic GC-derived MBCs (B220+IgDloGL7−CD38+ S1pr2-Tomato+).
(B) Percentage of CD44−CD62L− (left), CD44+CD62L− (middle), and CD44+CD62L+ (right) MBCs at day 8, 11, 15, and 30 post LCMV infection. Mice were injected intraperitoneally (i.p.) with tamoxifen on days 4 and 6 p.i. and then switched to a tamoxifen-containing chow. Data are representative of four independent experiments with at least three mice per group.
(C) Representative FACS plots (left) and percentage (right) of CD62L expression in GC-derived MBCs at day 60 post LCMV infection in S1pr2-ERT2creTdTomato mice treated with tamoxifen beginning at day 4, 16, or 30 p.i. Data are pooled from three independent experiments with at least three mice per group.
(D) Analysis of mismatch error rate frequency in 700 bp of the JH558 intronic sequence in GC-derived MBCs sorted based on CD62L expression at day 30 after LCMV infection. Number of sequences analyzed for each population is listed in the center of each circle. Sequences were pooled from two independent experiments with at least four mice per experiment. Statistical analysis performed by comparing number of mutations in each group.
(E) Representative FACS plots (left) and percentage (right) of IgM− cells in GC-derived MBC subsets at day 30 post LCMV infection. Data are representative of four independent experiments with at least three mice per group.
(F) Percentage of CD62L+ cells in CD45.1− GC-derived MBCs at day 45 post LCMV infection. CD62L− B cells were enriched from CD45.2+ donor mice at day 11 p.i. and transferred into CD45.1/2+ naive or infection-matched mice. Data are representative of two independent experiments with five mice per group. Statistical analyses were performed using the unpaired two-tailed Student’s t test (*p < 0.05, **p < 0.01, ***p < 0.001, ****p < 0.0001). See also Figures S1 and S2.