
Figure 3. CD44 and CD62L identify transcriptionally distinct subsets of MBCs.
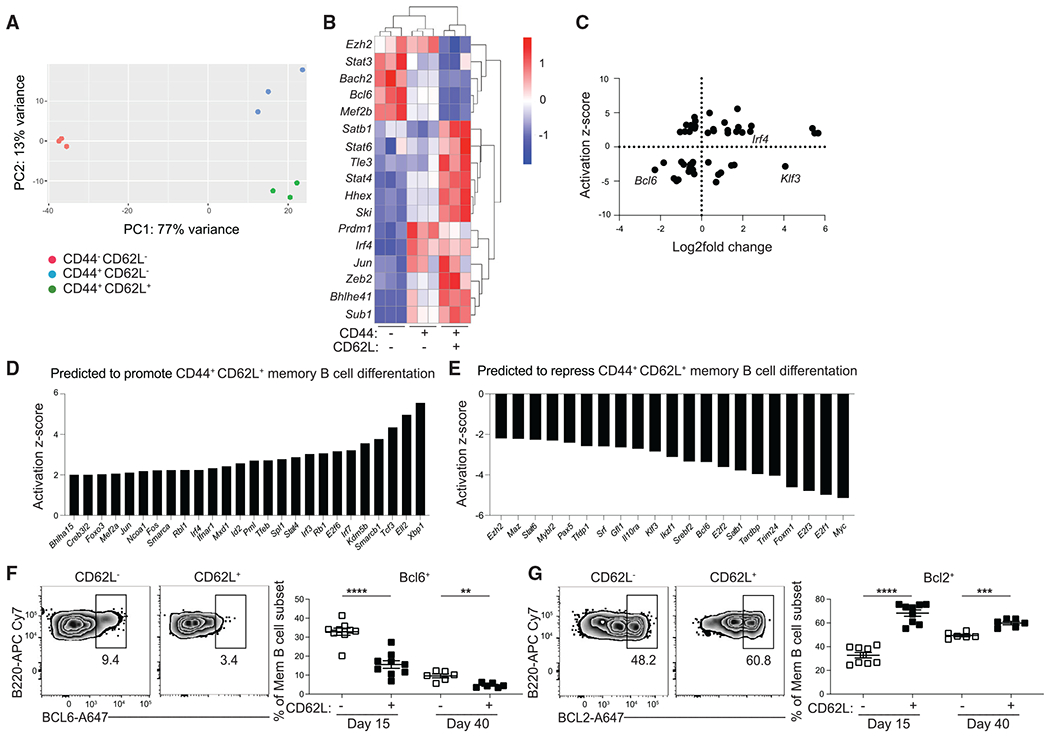
(A) Principal-component analysis of RNA-seq data from CD44− CD62L−, CD44+ CD62L+, and CD44+ CD62L+ splenic GC-derived MBCs (B220+IgDlo GL7−CD38+S1pr2-Tomato+) at day 15 post LCMV infection. Cells were sorted from three independent samples with at least three mice per samples.
(B) Heatmap of select differentially expressed genes (DEGs) among mRNA isolated from the aforementioned populations, presented as expression (log2) normalized by row. Genes with padj <0.1 and a base mean count across all three groups >50 were considered DEGs.
(C) Scatterplot of data analysis obtained from iPA with the y axis representing the activation Z score for potential upstream regulators. Positive score indicates promotion of CD44+ CD62L+ MBC differentiation and negative score indicates repression of CD44+ CD62L+ MBC differentiation. The x axis represents expression levels of differentially expressed TFs represented in log2-fold change. Negative scores indicate expression by CD44− CD62L− population and positive scores indicate expression by CD44+ CD62L+ population.
(D) List of TFs with an activation Z score greater than 2.
(E–G) (E) List of TFs with an activation Z score less than −2. Representative FACS plots (left) and percentage (right) of (F) BCL6 and (G) BCL2 in GC-derived MBCs (live B220+IgDloGL7−CD38+ S1pr2-Tomato+) subsets at day 15 and 40 post LCMV infection. Data are representative of four independent experiments with at least three mice per group. Statistical analyses were performed using the unpaired Student’s t test (**p < 0.01, ***p < 0.001, ****p < 0.0001). See also Figures S4 and S5.