
Figure 4. Bcl6 restricts development of CD62L+ MBCs.
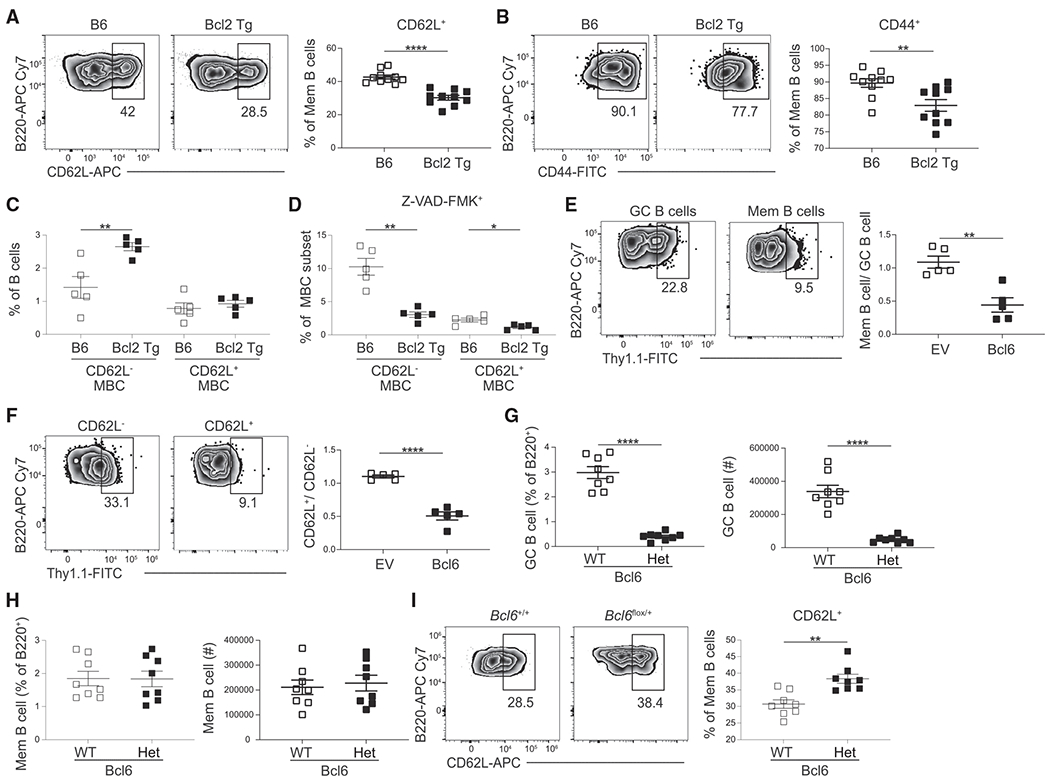
(A and B) Representative FACS plots (left) and percentage (right) of (A) CD62L or (B) CD44 expression in GC-derived MBCs (B220+IgDloGL7−CD38+ S1pr2-Tomato+) from control (B6) and Bcl2 transgenic mice at day 30 post infection. Data are pooled from two independent experiments with at least five mice per group.
(C) Percentage of B cells that are CD62L− or CD62L+ GC-derived MBCs (B220+IgDloGL7−CD38+ S1pr2-Tomato+) in control (B6) and Bcl2 transgenic mice at day 30 post infection.
(D) Percentage of VAD-FMK+ cells among the CD62L− or CD62L+ GC-derived MBC populations in B6 and Bcl2 transgenic mice at day 30 post infection. Data are representative of two independent experiments with at least five mice per group.
(E) Representative FACS plots (left) of the percentage of transduced (Thy1.1+) cells among splenic GC B cells (B220+IgDloGL7+CD95+) and MBCs (B220+IgDloGL7−CD38+CD95+CD73+) at day 30 post LCMV infection in empty vector (EV) and Bcl6-overexpressing cells. Ratio of transduced MBCs relative to GC B cells shown on right.
(F) Representative FACS plots (left) of the percentage of transduced (Thy1.1+) cells among CD62L− and CD62L+ MBCs (B220+IgDloGL7−CD38+CD95+CD73+) at day 30 post LCMV infection in EV and Bcl6-overexpressing cells. Ratio of transduced CD62L+ MBCs relative to CD62L− MBCs cells shown on right. Transduction efficiencies varied between constructs. The MSCV2.2 retroviral vector was used for all transductions. Data are representative of four independent experiments with at least three mice per group.
(G) Percentage (left) and number (right) of GC B cells (B220+IgDloGL7+CD38−Aid-Tomato) in Bcl6+/+ (WT) and Bcl6flox/+ (Het) AidCre Ai14 mice at day 30 post LCMV infection.
(H) Percentage (left) and number (right) of MBCs (right; B220+IgDloGL7−CD38+Aid-Tomato+) in Bcl6 WT and Het mice at day 30 post LCMV infection.
(I) Representative FACS plots (left) and percentage (right) of the CD62L expression on MBCs from Bcl6 WT and Het mice at day 30 post LCMV infection. Data are representative of two independent experiments with at least five mice per group. Statistical analyses were performed using the unpaired two-tailed Student’s t test (*p < 0.05, **p < 0.01, ****p < 0.0001).