
Figure 1: Grip strength of cases and controls in the GFC2022 and Potter 2013 cohorts by age and weight.
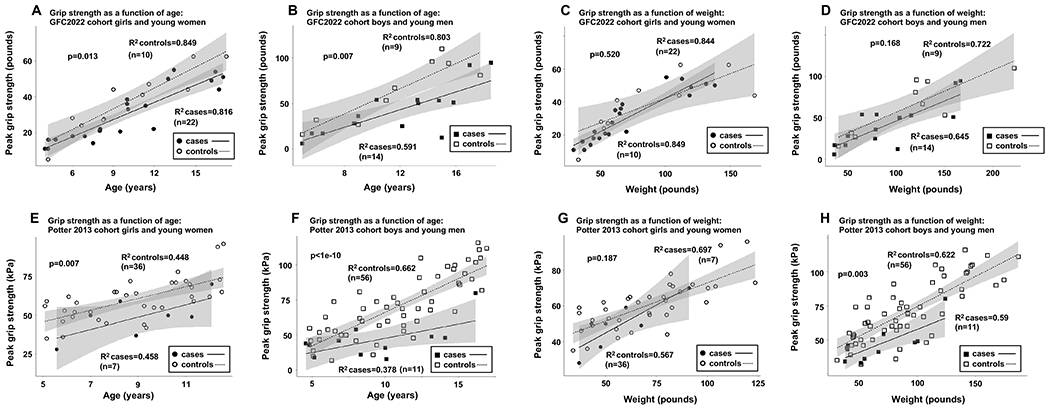
(A) Girls and young women with CG in the GFC2022 cohort showed significantly diminished peak hand grip strength as a function of age relative to controls. (B) Boys and young men with CG in the GFC2022 cohort showed significantly diminished peak hand grip strength as a function of age relative to controls. (C) Peak hand grip strength as a function of weight was not statistically lower in girls and young women with CG in the GFC2022 cohort compared to controls. (D) Peak hand grip strength as a function of weight was not statistically lower in boys and young men with CG in the GFC2022 cohort compared to controls. (E) Girls and young women with CG in the Potter 2013 cohort showed significantly diminished peak hand grip strength as a function of age relative to controls. (F) Boys and young men with CG in the Potter 2013 cohort showed significantly diminished peak hand grip strength as a function of age relative to controls. (G) Peak hand grip strength as a function of weight was not statistically lower in girls and young women with CG in the Potter 2013 cohort compared to controls. (H) Peak hand grip strength as a function of weight remained statistically lower in boys and young men with CG in the Potter 2013 cohort compared to controls. P-values were calculated using non-linear mixed effects models. In panels A, B, E, and F age was a fixed covariate in the model, and in panels C, D, G, and H weight was a fixed covariate in the model. In all analyses, an individual’s ID number was included as a random variable.