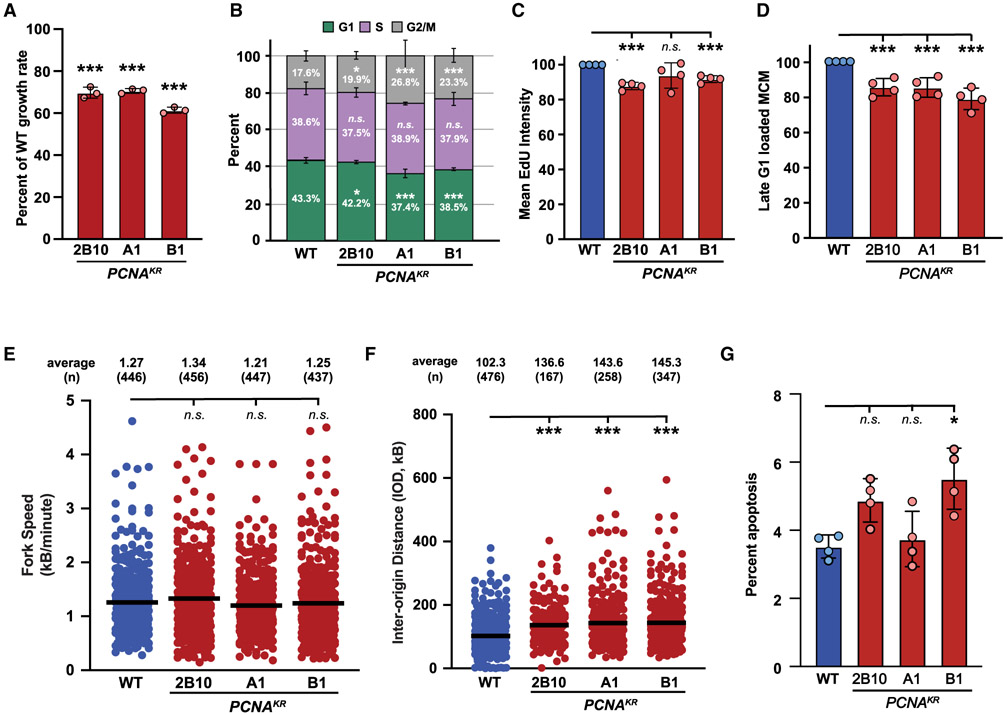
Figure 2. The PCNA-K164R mutation disrupts DNA replication without exogenous genotoxic stress.
(A) Average cell proliferation rate in PCNAK164R cell lines normalized to wild type. For each cell line, n = 9 wells across three biological replicates. Error bars indicate standard deviation, and significance was calculated using one-way ANOVA with *p < 0.05, **p < 0.01, and ***p < 0.001.
(B) Cell-cycle distribution of RPE-1 wild-type and PCNAK164R cell lines from four biological replicates. Percentage of each population in G1 (green), S (purple), or G2/M phase (gray) is shown. Error bars indicate standard deviation, and significance was calculated using Student’s t test with *p < 0.05, **p < 0.01, and ***p < 0.001.
(C) Quantification of mean fluorescent intensity of EdU staining in S-phase cells from RPE-1 wild-type (blue) and PCNAK164R cells (maroon); n = 12 across four biological replicates. Error bars indicate standard deviation, and significance was calculated using Student’s t test with *p < 0.05, **p < 0.01, and ***p < 0.001.
(D) Quantification of the percentage of MCM2-stained cells in late G1 from RPE-1 wild-type (blue) and PCNAK164R cells (maroon); n = 12 across four biological replicates. Error bars indicate standard deviation, and significance was calculated using Student’s t test with ***p < 0.001.
(E) Fork speed quantification from two biological replicates in RPE-1 wild-type (blue) and PCNAK164R cells (maroon). Average IOD and number (n) quantified are listed. Significance was calculated by Kruskal-Wallis with Dunn’s multiple comparison test with ***p < 0.001.
(F) IOD quantification from two biological replicates in RPE-1 wild-type (blue) and PCNAK164R cells (maroon). Average IOD and number (n) quantified are listed. Significance was calculated by Kruskal-Wallis with Dunn’s multiple comparison test with ***p < 0.001.
(G) Percentage of apoptotic cells in RPE-1 wild-type (blue) and PCNAK164R populations. Error bars indicate standard deviation, and significance was calculated by Kruskal-Wallis with Dunn’s multiple comparison test with *p < 0.05; n = 12 replicates across four biological replicates.

