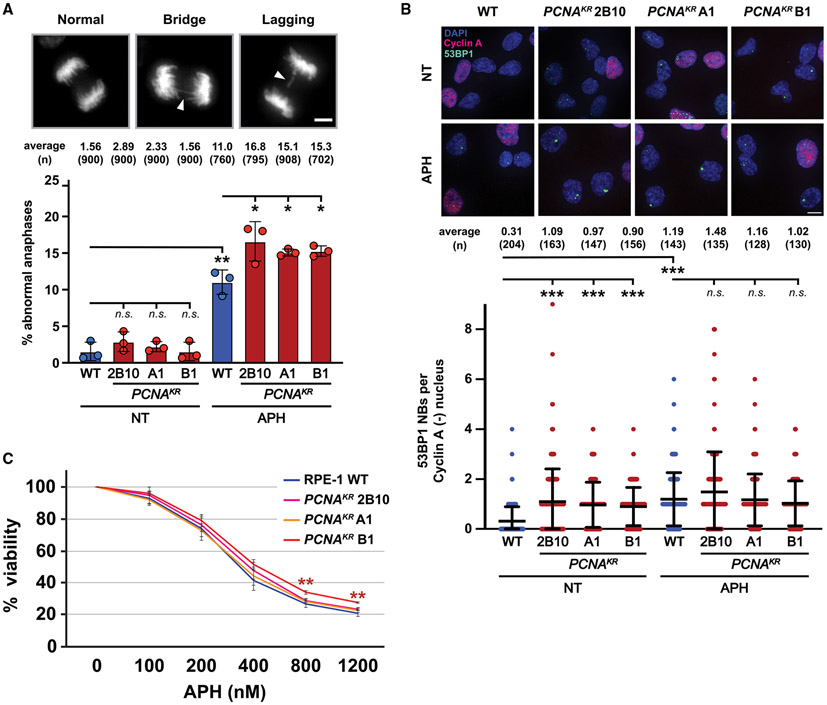
Figure 3. Phenotypes associated with DNA under-replication are increased in PCNAK164R mutants.
(A) (Top) Representative images of DAPI-stained chromosomes during anaphase: (left) normal, (middle) chromatid bridge, and (right) lagging chromosome. Scale bar, 5 μm. (Bottom) Percentage of abnormal anaphases in UT and APH-treated cells in wild-type (blue) and PCNAK164R lines (maroon). Number (n) of anaphases quantified is listed. Error bars indicate standard deviation, and significance was calculated using Student’s t test with *p < 0.05.
(B) (Top) Image of 53BP1 NB and cyclin A staining in RPE-1 cell lines. DAPI (blue), 53BP1 NB (green), and cyclin A (pink) are indicated. Scale bar, 20 μm. (Bottom) 53BP1 NB quantification of UT and APH-treated cells in wild type (blue) and PCNAK164R lines (maroon). Number (n) of nuclei quantified is listed. Error bars indicate standard deviation, and significance was calculated using Kruskal-Wallis with Dunn’s multiple comparison test.
(C) Comparison of APH sensitivity based on the average percentage viability at each APH concentration in RPE-1 wild-type and PCNAK164R cell lines. Concentrations tested are indicated. Error bars indicate standard deviation, and statistical significance was calculated using Student’s t test when comparing wild-type cells with each respective PCNAK164R cell line with *p < 0.05, **p < 0.01, and ***p < 0.001; n = 9–12 replicate wells across three biological replicates for all data points.

