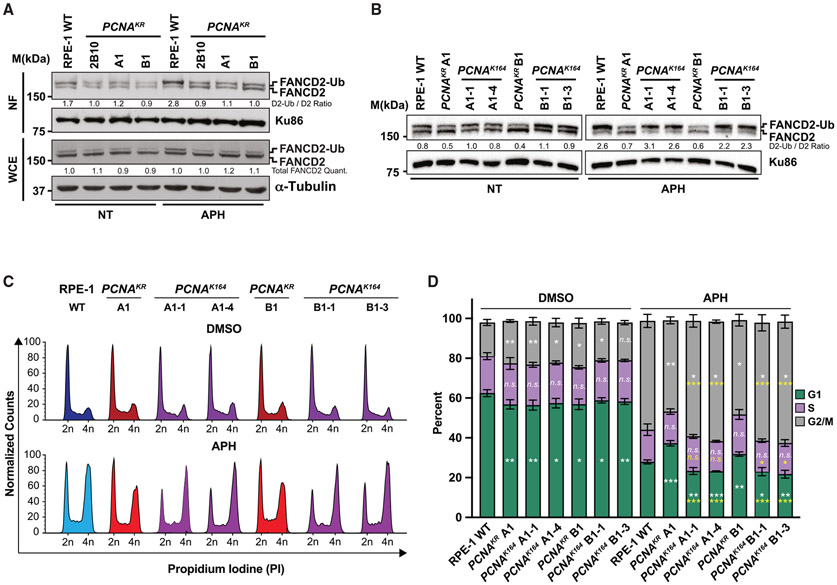
Figure 5. PCNA K164 is required for robust FANCD2 ubiquitination and chromatin association.
(A) Western blot analyses of FANCD2 with Ku86 or Tubulin as the loading control in nuclear fractions (top) or whole-cell extracts (bottom) from RPE-1 wild-type and PCNAK164R cells with or without 300 nM APH treatment. Quantified band intensities were normalized to loading controls.
(B) Western blot analyses of FANCD2 with Ku86 as the loading control in whole-cell extracts (bottom) from RPE-1 wild-type, PCNAK164R, and reverted PCNAK164 cells with or without 300 nM APH treatment. Quantified band intensities were normalized to loading controls.
(C) Representative cell-cycle distributions based on propidium iodide staining from RPE-1 wild-type, PCNAK164R, and reverted PCNAK164 cells with or without 300 nM APH treatment.
(D) Cell-cycle distributions of RPE-1 wild-type, PCNAK164R and reverted PCNAK164 cell lines from two biological replicates. Percentage of each population in G1 (green), S (purple), or G2/M phase (gray) is shown. Error bars indicate standard deviation, and significance was calculated using Student’s t test with *p < 0.05, **p < 0.01, and ***p < 0.001. Statistics in white text represent comparisons between each cell-cycle phase versus wild type in each treatment condition. Statistics in yellow text represent comparisons between each cell-cycle phase in reverted PCNAK164 cell lines versus their parental PCNAK164R mutant with 300 nM APH treatment.

