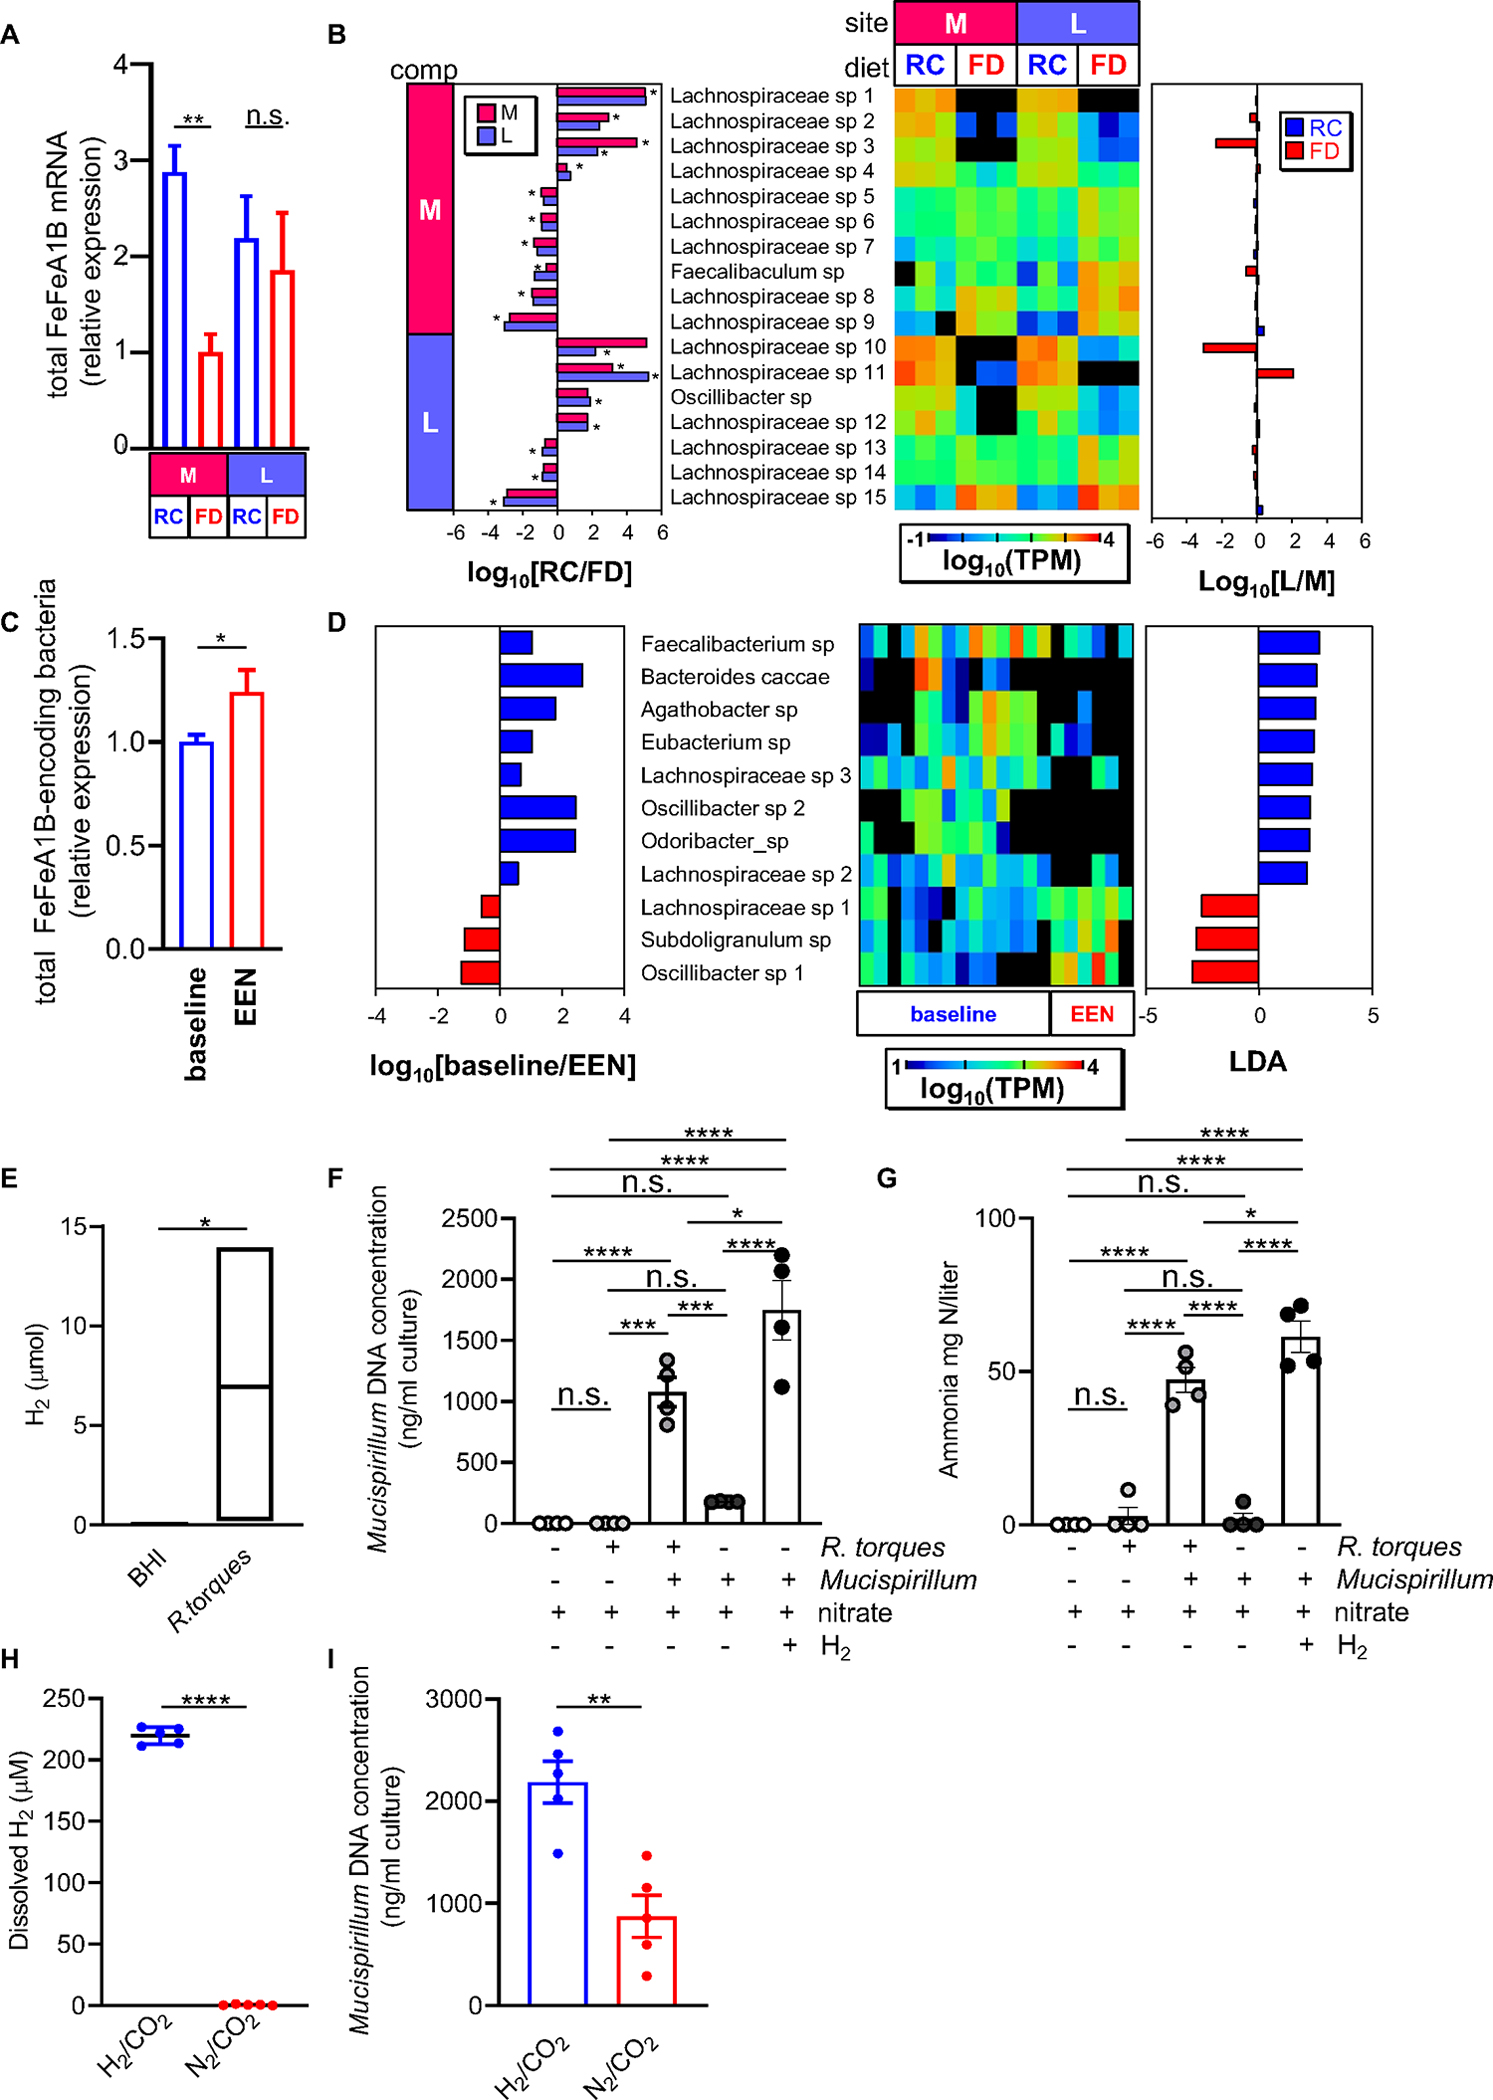
Figure 6. Fiber exclusion alters fermentative H2 metabolism and interspecies H2 transfer.

(A) Relative expression level of total FeFe hydrogenase groups A1 and B in mucus (M) and luminal (L) compartments of RC-fed and FD-fed Tac-DKO mice. FeFe Groups A1 and B expression was normalized to 20 housekeeping genes. (B) Genes were selected by comparison between RC and FD at L and M compartments. Microbial species that were differentially abundant in RC vs FD group, and in L vs M are shown as log10 RC/FD (left panel), log10 TPM (central heat map), and log10 L/M (right panel). (C) Abundance of total bacterial FeFe hydrogenase group A1 and B homologues normalized by the abundance of 20 housekeeping genes in the data obtained from CD patients (Original raw data SRP057027 retrieved from 26). (D) Specific FeFe A1/B homologues-harboring species with differential abundance between baseline and 1-week EEN treatment (right panel) are shown with heat map (central panel, log10 TPM) and LDA values of LEfSe with p<0.05 (left panel). (E) H2 content in R. torques cultures (enriched BHI medium, control). Mucispirillum was grown in the presence/absence of R. torques, nitrate (10mM) and H2 (80%) in enriched BHI. Mucispirillum growth (F) and ammonium measurements (G) were assessed after three days. Co-cultures of R. torques and Mucispirillum in bioreactor vessels sparged with a mixed gas containing 20% CO2 and either 80% N2 or 80% H2. (H) Dissolved H2 concentration at 26.5 hours post-inoculation. (I) Mucispirillum growth at day 3 post-inoculation.
Each symbol represents one mouse. Data are mean ± SEM (A, C, F-I), or floating bars show max and min values and line at median (E), and representative of at least two independent experiments, n= 4–5 per group. **p<0.01; ***p<0.001; ****p<0.0001; n.s. not significant by one-way ANOVA followed by Tukey’s post-test (A, F-G), by two-tailed Mann-Whitney U test (*p=0.02, C; *p=0.0286, E), or by two-tailed unpaired t-test (****p<0.0001, H; **p=0.0020, I). See also Figure S7; Table S5, S6 and S7.
