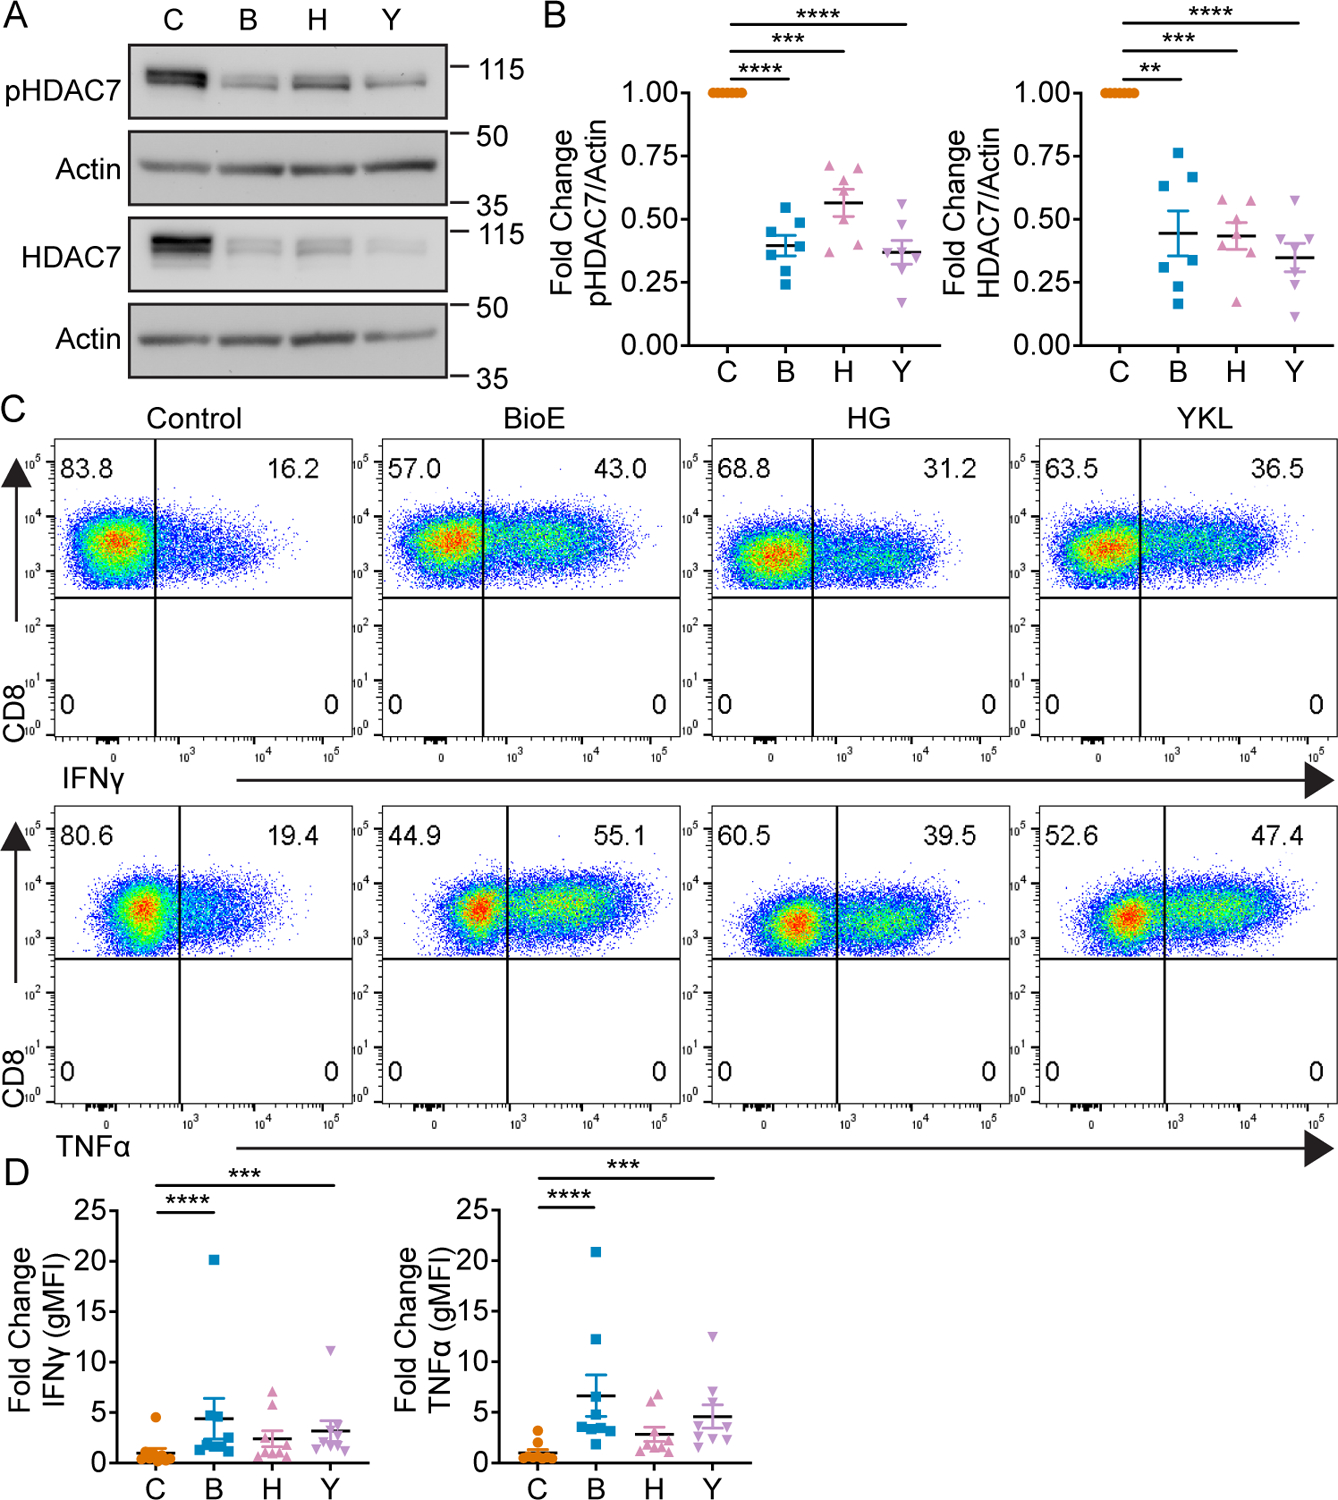
Figure 3. SIKs regulate phosphorylation dependent stabilization of HDAC7 and lineage specific cytokine production in CD8+ T cells.

(A) Representative western blot of phosphorylated and total HDAC7 by CD8+ T cells on day four after activation and differentiation in either control (DMSO), BioE-1197 (50 μM), HG-9-91-01 (HG, 25 nM) or YKL-05–099 (YKL, 270 nM) differentiation conditions. (B) Quantification of the fold change in phosphorylated (left) and total HDAC7 (right) production in CD8+ T cells represented in A across independent experiments. (C) Representative intracellular cytokine staining dot plots of IFNγ (top) and TNFα (bottom) production by CD8+ T cells on day six after activation and differentiation in either control (DMSO), BioE-1197 (50 μM), HG-9-91-01 (HG, 25 nM) or YKL-05–099 (YKL, 270 nM) conditions. (D) Quantification of the fold change in gMFI of IFNγ (left) and TNFα (right) production in CD8+ T cells represented in C across independent experiments. Each dot represents values from an independent experiment, summary data are presented as the mean (black line) with SEM error bars (B, D). Repeated measures one-way ANOVA, Dunnet’s multiple comparisons test (B). Friedman test, Dunn’s multiple comparisons test (D). *p ≤ 0.05, **p ≤ 0.01, ***p ≤ 0.001, ****p ≤ 0.0001, ns = not significant.
