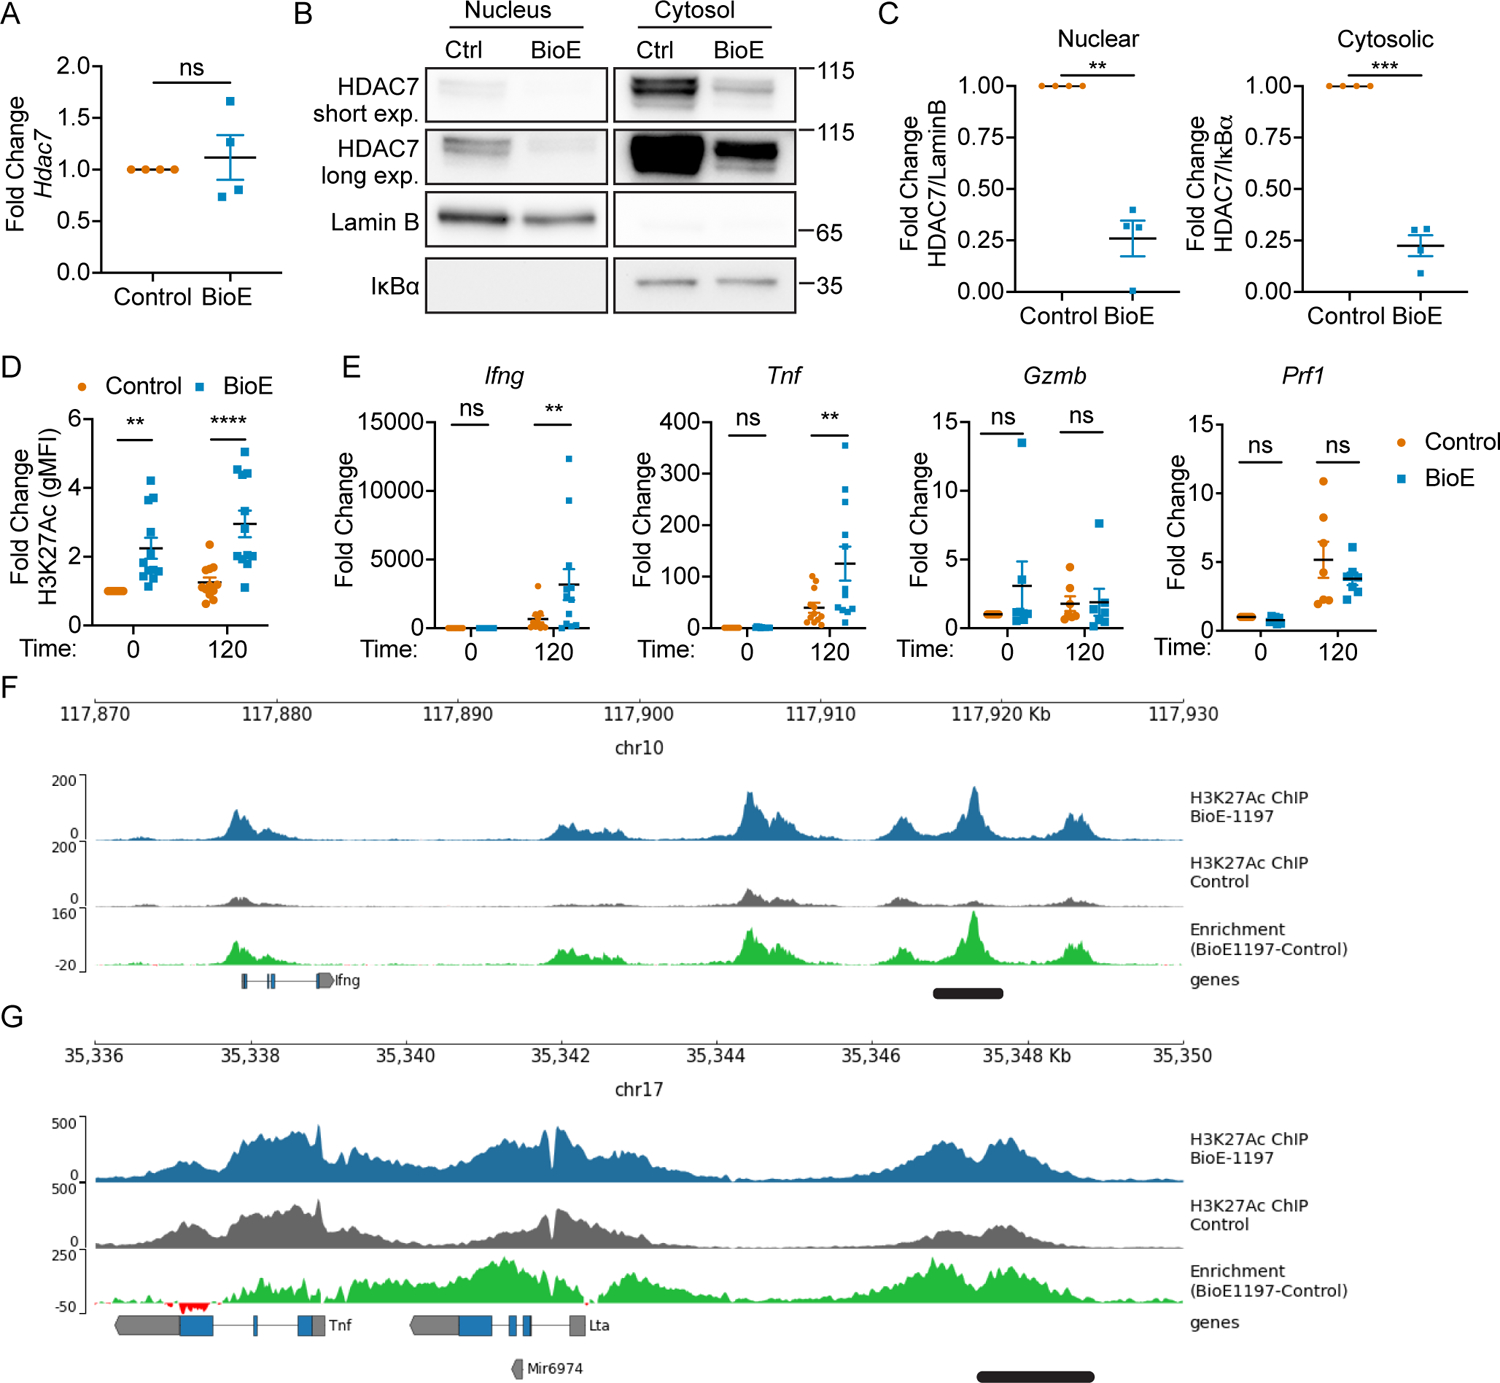
Figure 4. Phosphorylation dependent stabilization enhances nuclear availability of HDAC7 and epigenetically restricts effector cytokine loci.

(A) Fold change in HDAC7 mRNA levels of CD8+ T cells on day six after activation and differentiation in control (DMSO) or BioE-1197 (50μM) conditions. (B) Representative western blot of HDAC7 from subcellular fractionation of CD8+ T cells on day three after activation and differentiation in control (DMSO) or BioE-1197 (50μM) conditions. Lamin B and IκBα serve as nuclear and cytosolic compartment loading controls, respectively. (C) Quantification of the fold change in HDAC7 localization represented in B across independent experiments in CD8+ T cells on day three after activation and differentiation in control (DMSO) or BioE-1197 (50μM) conditions. (D) Quantification of the fold change in global H3K27Ac levels for control (DMSO) and BioE-1197 (50μM) differentiated CD8+ T cells prior to re-stimulation and two hours after re-stimulation on day six after activation and differentiation across independent experiments. (E) Fold change of Ifng, Tnf, Gzmb, and Prf1 mRNA transcript abundance prior to re-stimulation and two hours after re-stimulation in CD8+ T cells on day six after activation and differentiation in control (DMSO) or BioE-1197 (50μM) across independent experiments. (F) H3K27Ac mark deposition within the Ifng loci in control and BioE-1197 (50μM) differentiated CD8+ T cells on day six after activation and differentiation. (G) H3K27Ac mark deposition within the Tnf loci in control and BioE-1197 (50μM) differentiated CD8+ T cells on day six after activation and differentiation. Each dot represents values from an independent experiment, summary data are presented as the mean (black line) with SEM error bars (A, C, D, E). Results are representative of three, independent biological replicates, additional replicates presented in Supplemental Figure 3 (F,G). Paired t-test (A,C). Two-way ANOVA, Sidak’s multiple comparisons test (D, E). *p ≤ 0.05, **p ≤ 0.01, ***p ≤ 0.001, ****p ≤ 0.0001, ns = not significant.
