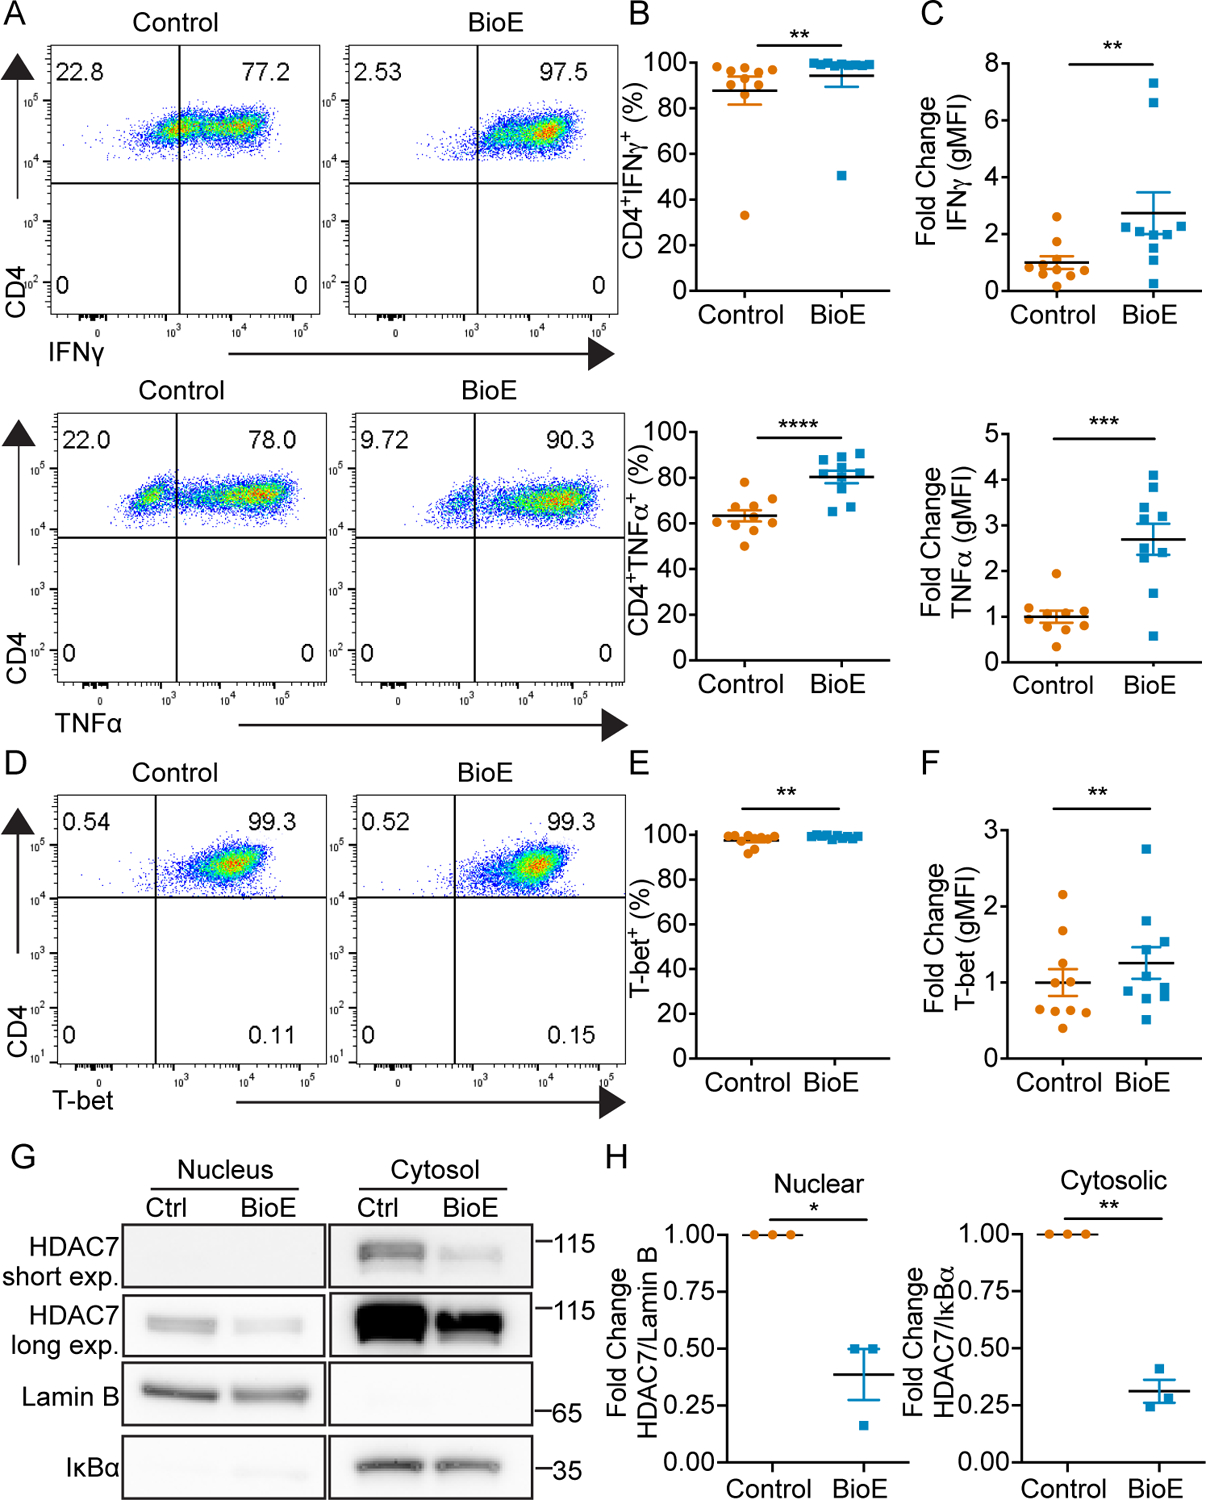
Figure 5. BioE-1197 enhances effector cytokine production and regulates HDAC7 stability and localization in CD4+ Th1 cells.

(A) Representative intracellular cytokine staining dot plots of IFNγ (top) and TNFα (bottom) production upon re-stimulation of Th1 cells on day six after activation and differentiation in control (DMSO) or BioE-1197 (50μM) conditions. (B) Quantification of the percent of IFNγ (top) and TNFα (bottom) cytokine positive Th1 cells represented in A across independent experiments. (C) Quantification of the fold change in gMFI of IFNγ (top) and TNFα (bottom) production by Th1 cells represented in A across independent experiments. (D) Representative intracellular staining dot plots of T-bet in Th1 cells on day six after activation and differentiation in control (DMSO) or BioE-1197 (50μM) conditions. (E) Quantification of the percent of T-bet positive cells represented in D across independent experiments. (F) Quantification of the fold change in gMFI of T-bet by CD8+ T cells represented in D across independent experiments. (G) Representative western blot of HDAC7 from subcellular fractionation of Th1 cells on day three after activation and differentiation in control (DMSO) or BioE-1197 (50μM) conditions. Lamin B and IκBα serve as nuclear and cytosolic compartment loading controls, respectively. (H) Quantification of the fold change in HDAC7 localization represented in G across independent experiments in Th1 cells on day three after activation and differentiation in control (DMSO) or BioE-1197 (50μM) condition. Each dot represents values from an independent experiment, summary data are presented as the mean (black line) with SEM error bars (B-C, E-F, H). Wilcoxon test (B-IFNγ, C-IFNγ, E). Paired t-test (B-TNFα, C-TNFα, F, H). *p ≤ 0.05, **p ≤ 0.01, ***p ≤ 0.001, ****p ≤ 0.0001, ns = not significant.
