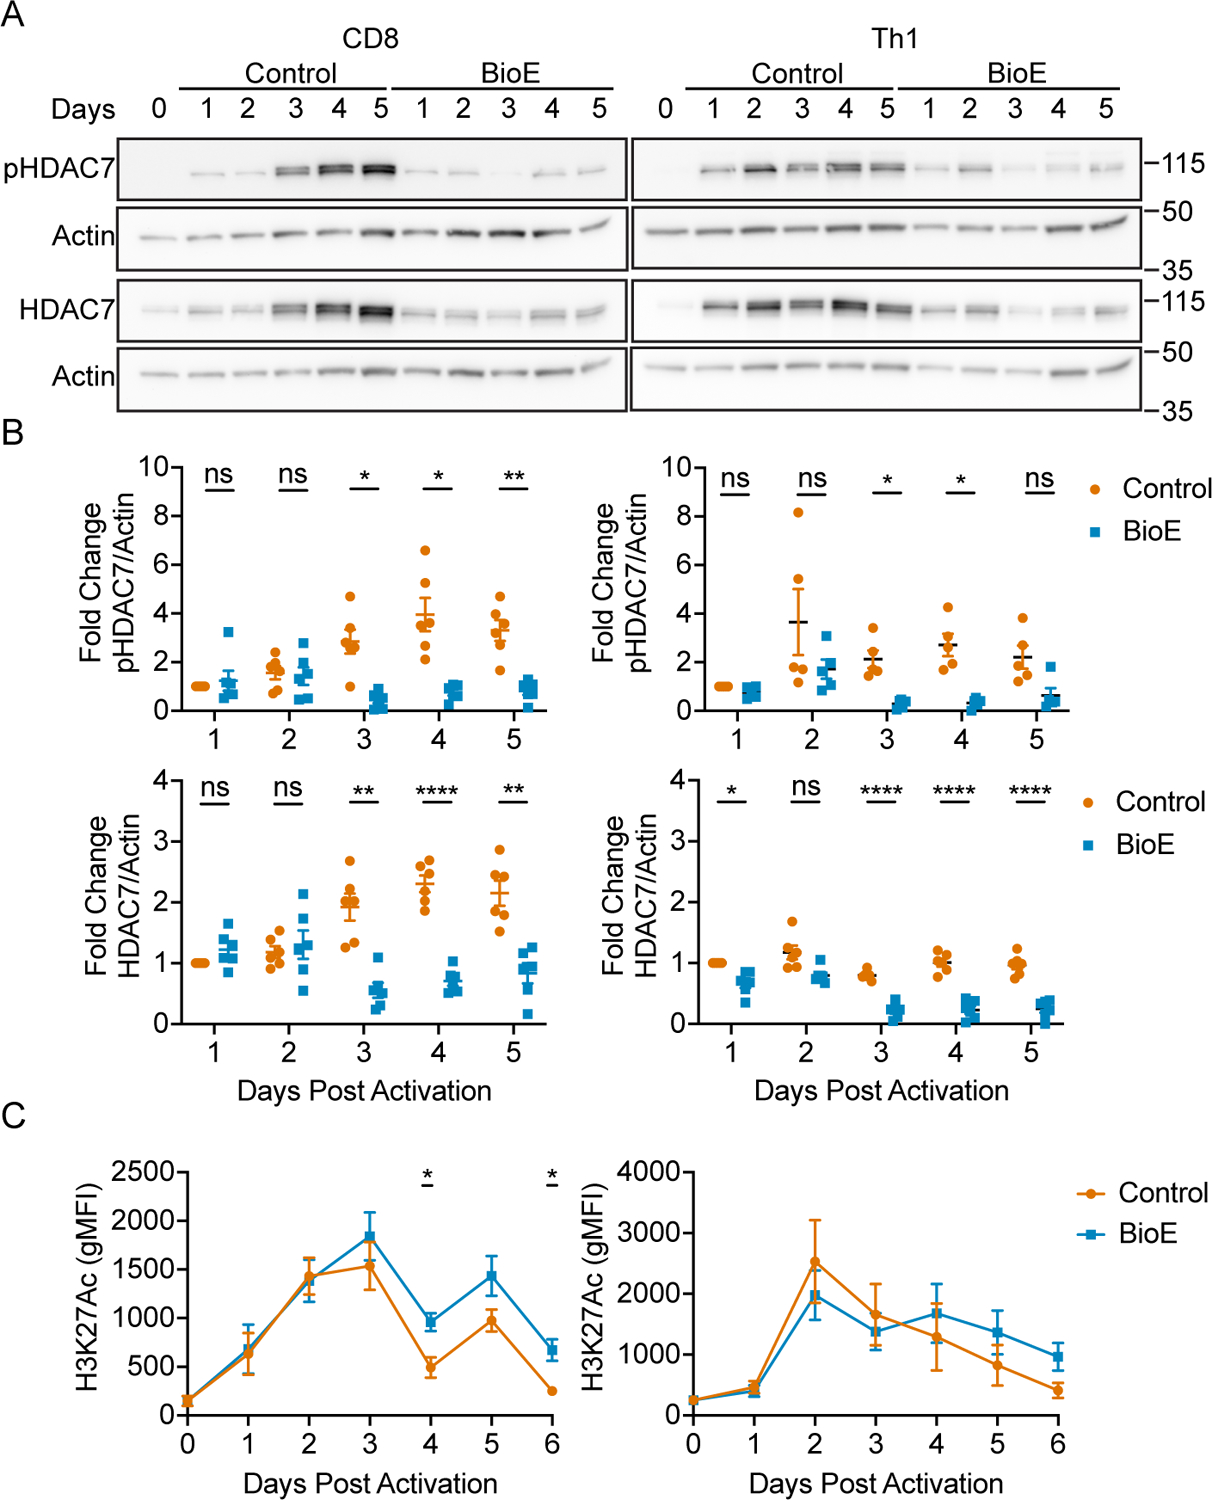
Figure 7. Phosphorylation dependent stabilization of HDAC7 occurs during late-stage differentiation of CD8+ and Th1 effector.

(A) Representative western blots for control (DMSO) and BioE-1197 (50μM) differentiated CD8+ (left) and Th1 (right) cells for phosphorylated and total HDAC7. (B) Quantification of the fold change in phosphorylated (top) and total (bottom) HDAC7 in CD8+ (left) and Th1 (right) cells represented in A across independent experiments. (C) Quantification of global H3K27Ac marks over time in CD8+ (left) and Th1 (right) cells differentiated in control (DMSO) and BioE-1197 (50μM) conditions. Each dot represents values form an independent experiment, summary data are presented as the mean (black line) with SEM error bars (B). The mean and standard error of measurement (SEM) are presented for 12 independent experiments (C). Two-way ANOVA, Sidak’s multiple comparisons test (B). Mixed effects analysis, Sidak’s multiple comparisons test (C). *p ≤ 0.05, **p ≤ 0.01, ***p ≤ 0.001, ****p ≤ 0.0001, ns = not significant.
