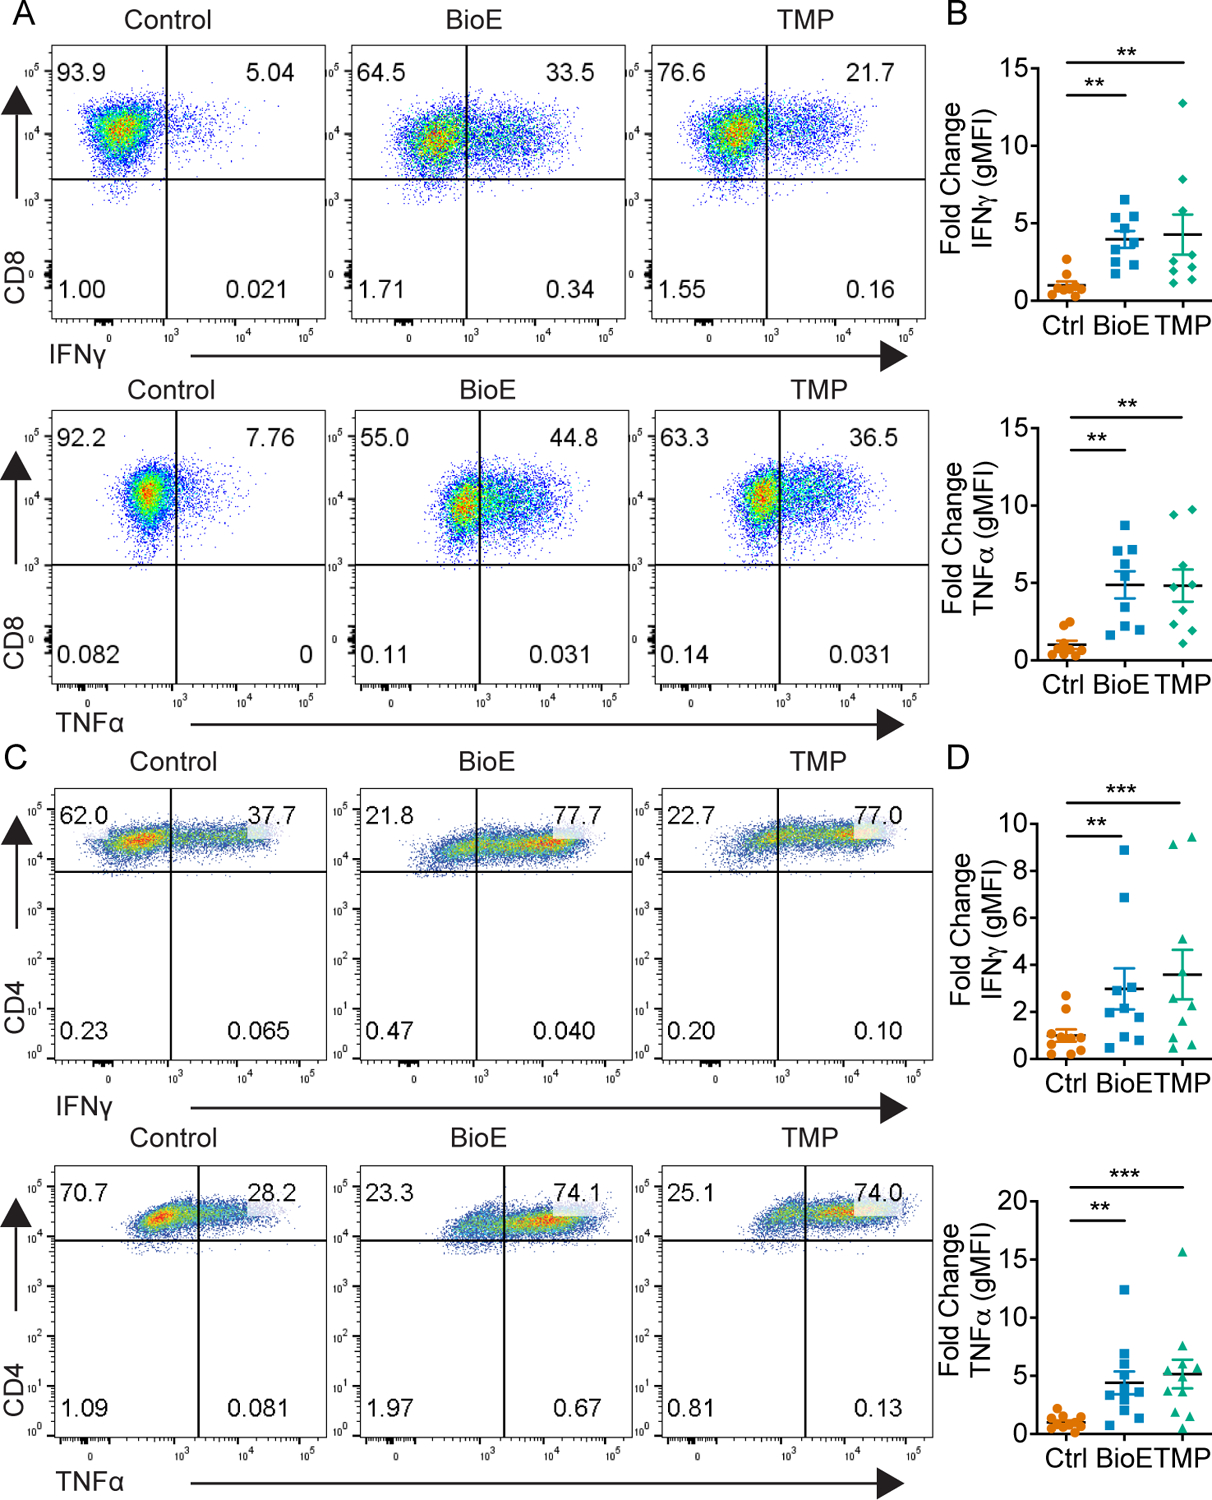
Figure 8. Late-stage class IIa HDAC inhibition elevates effector cytokine production.

(A) Representative dot plots of IFNγ (top) and TNFα (bottom) production by CD8+ T cells on day six after activation and differentiation in either control (DMSO), BioE-1197 (50μM), or TMP269 (TMP, 12.5 μM) conditions. (B) Quantification of the fold change in gMFI of IFNγ (top) and TNFα (bottom) production in CD8+ T cells represented in A across independent experiments. (C) Representative dot plots of IFNγ (top) and TNFα (bottom) production by Th1 cells on day six after activation and differentiation in either control (DMSO), BioE-1197 (50μM), or TMP269 (TMP, 12.5 μM)) conditions. (D) Quantification of the fold change in gMFI of IFNγ (top) and TNFα (bottom) production in Th1 cells represented in C across independent experiments. Each dot represents values from an independent experiment, summary data are presented as the mean (black line) with SEM error bars (B,D). Friedman test, Dunn’s multiple comparisons test (B,D). *p ≤ 0.05, **p ≤ 0.01, ***p ≤ 0.001, ****p ≤ 0.0001.
