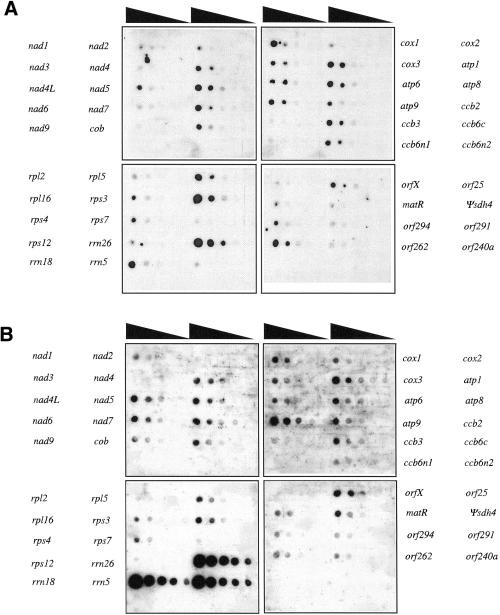
Fig. 1. Autoradiograms of the nylon filters representing the Arabidopsis mitochondrial gene content were hybridized with mitochondrial run-on transcripts (A) or with 5′ labeled steady state mitochondrial transcripts (B). Black triangles indicate the decreasing amount of DNA on the filters with the highest concentration of probe on the left and the lowest on the right. The correspondence between genes and spot rows is indicated beside the autoradiograms.

An official website of the United States government
Here's how you know
Official websites use .gov
A
.gov website belongs to an official
government organization in the United States.
Secure .gov websites use HTTPS
A lock (
) or https:// means you've safely
connected to the .gov website. Share sensitive
information only on official, secure websites.
