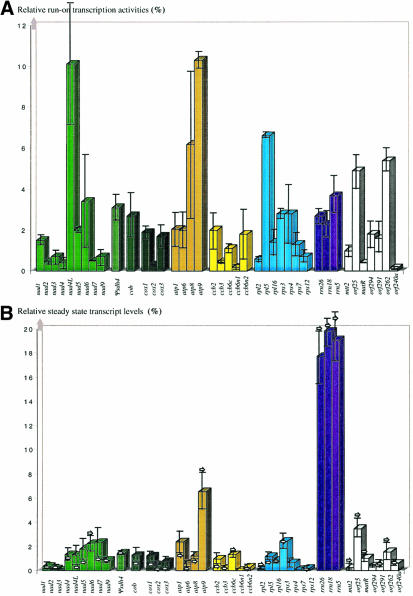
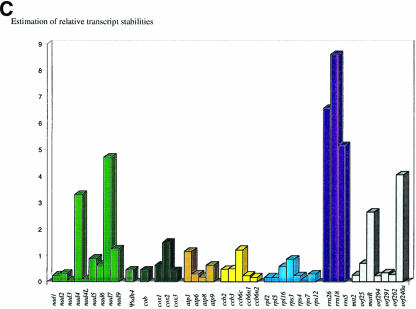
Fig. 2. Histograms indicating the respective transcriptional activity (A), steady state transcript levels (B) and deduced transcript stability (C). The values displayed in (A) and (B) are expressed as a percentage of the total amounts observed in the respective experiments. The bars indicate the standard deviation obtained in four experiments each for (A) and (B). Arrows in (B) specify the values obtained when filters were hybridized with 3′-labeled RNA. The transcript stability values shown in (C) are calculated by dividing the average steady state value by the average run-on value. The histogram columns are grouped into the gene families of complex I, complex II, complex III, complex IV, complex V, cytochrome c biogenesis, ribosomal proteins and rRNA genes. Another category includes novel orfs and unclassified genes.

An official website of the United States government
Here's how you know
Official websites use .gov
A
.gov website belongs to an official
government organization in the United States.
Secure .gov websites use HTTPS
A lock (
) or https:// means you've safely
connected to the .gov website. Share sensitive
information only on official, secure websites.

