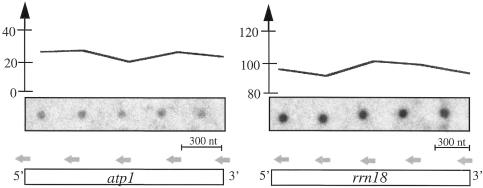
Fig. 3. Distribution of run-on values along a given gene sequence. Oligonucleotides complementary to the atp1 and rrn18 transcripts (horizontal gray arrows) were spotted on nylon filters and hybridized with mitochondrial run-on transcripts (central part of the figure) obtained by incorporating [α-32P]UTP. The intensity of the signals was quantified and its variation from 5′ to 3′ is indicated in the upper part of the figure.

An official website of the United States government
Here's how you know
Official websites use .gov
A
.gov website belongs to an official
government organization in the United States.
Secure .gov websites use HTTPS
A lock (
) or https:// means you've safely
connected to the .gov website. Share sensitive
information only on official, secure websites.
