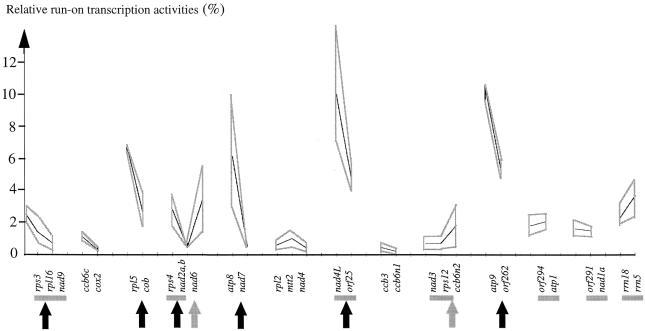
Fig. 4. Variation of transcription activity (expressed for each gene as a percentage of the total run-on activity) among closely spaced genes in Arabidopsis mitochondria. The genes or exons are listed in 5′ to 3′ for each genomic region. Horizontal gray bars designate genes that have been found to be co-transcribed in previous cDNA analyses (Brandt et al., 1992; Lippok et al., 1996; Giegé and Brennicke, 1999). Gray lines delimit the highest and lowest values calculated for the respective genes. Decreases from one gene to another within a given genomic region are indicated by vertical black arrows, an increase by a gray arrow.

An official website of the United States government
Here's how you know
Official websites use .gov
A
.gov website belongs to an official
government organization in the United States.
Secure .gov websites use HTTPS
A lock (
) or https:// means you've safely
connected to the .gov website. Share sensitive
information only on official, secure websites.
