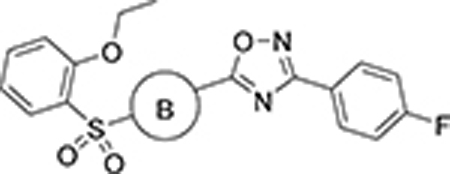
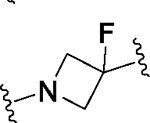
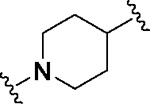
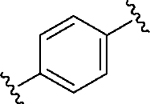
Table 4.
Ring B library compoundsd

| ||||
|---|---|---|---|---|
|
| ||||
| No. | B | Modea | IC50 / EC50 (μM)b | Efficacy (%)b,c |
|
| ||||
| 69 |

|
Act | 4.0 | 14 |
| 70 |

|
Inh | 9.2 | 98 |
| 71 |

|
Inh | >10 | 24 |
| 73a |

|
Inactive | ||
| 73b |

|
Inh | >10 | 52 |
| 74 |

|
Inh | >10 | 31 |
| 75 |

|
Inh | >10 | 63 |
| 76 |

|
Inh | 4.9 | 105 |
| 77 |

|
Inactive | ||
Inh = inhibitor; Act = activator; NA = not active
Concentration-response curve (CRC) from Tl+ flux assay in HEK-293 cells expressing WT SLACK
Amplitude of response in the presence of 30 μM test compound as a percentage of the maximum response for VU0606170 (inhibitors) or loxapine (activators)
Synthesis described in Supplementary Material
