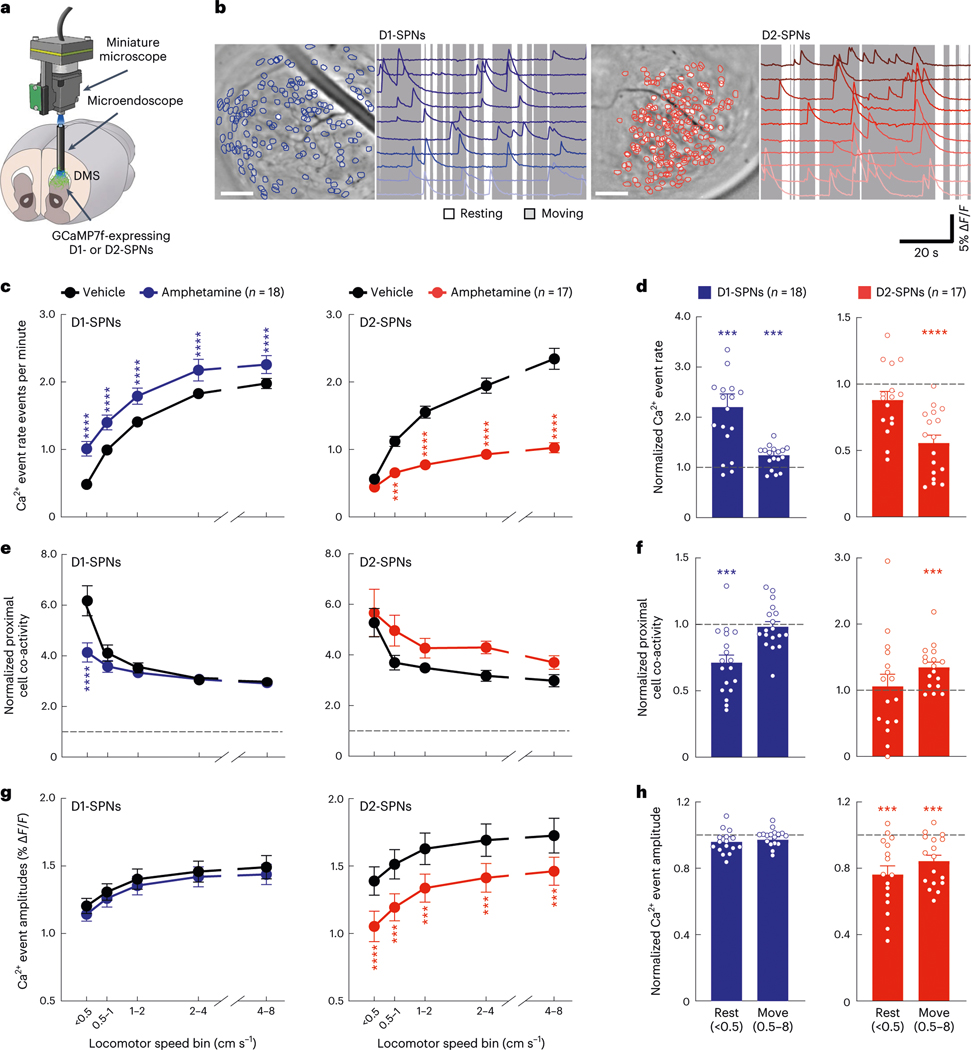
Fig. 1 |. Effects of amphetamine treatment on D1-SPN/D2-SPN Ca2+ activity in freely behaving mice.
a, We used a miniature microscope and microendoscope to image Ca2+ activity in D1-SPNs and D2-SPNs by expressing GCaMP7f in the DMS. b, Cell centroid locations overlaid on mean fluorescence images of DMS and example Ca2+ activity traces from D1-SPNs and D2-SPNs in representative D1-Cre (left) and A2A-Cre (right) mice. Scale bars, 100 μm. c,d, Effects of vehicle or amphetamine on D1-SPN and D2-SPN Ca2+ event rates across increasing locomotor speed bins (c) or averaged across resting (< 0.5 cm s−1) and moving (0.5–8 cm s−1) speed bins (d) and normalized to mean values after vehicle-only treatment. e,f, Effects of vehicle or amphetamine on the co-activity of proximal D1-SPN and D2-SPN pairs (25–125-μm separation), normalized to temporally shuffled comparisons, across different speed bins (e) or averaged across resting and moving speed bins (f) and normalized to mean values after vehicle-only treatment. g,h, Effects of vehicle or amphetamine on D1-SPN and D2-SPN Ca2+ event amplitudes across different speed bins (g) or averaged between resting and moving speed bins (h) and normalized to mean values after vehicle-only treatment. Data are expressed as mean ± s.e.m. (n = 18 D1-Cre and n = 17 A2A-Cre mice; ****P < 10−4 and ***P < 10−3 for comparison to vehicle treatment; two-way ANOVA with Holm–Sidak’s multiple comparison test for c,e,g; Wilcoxon, two-tailed signed-rank test for d,f,h). Exact P values for these and all other analyses are in the Supplementary Table. All n values reported within the actual figures or legends refer to the number of mice.

