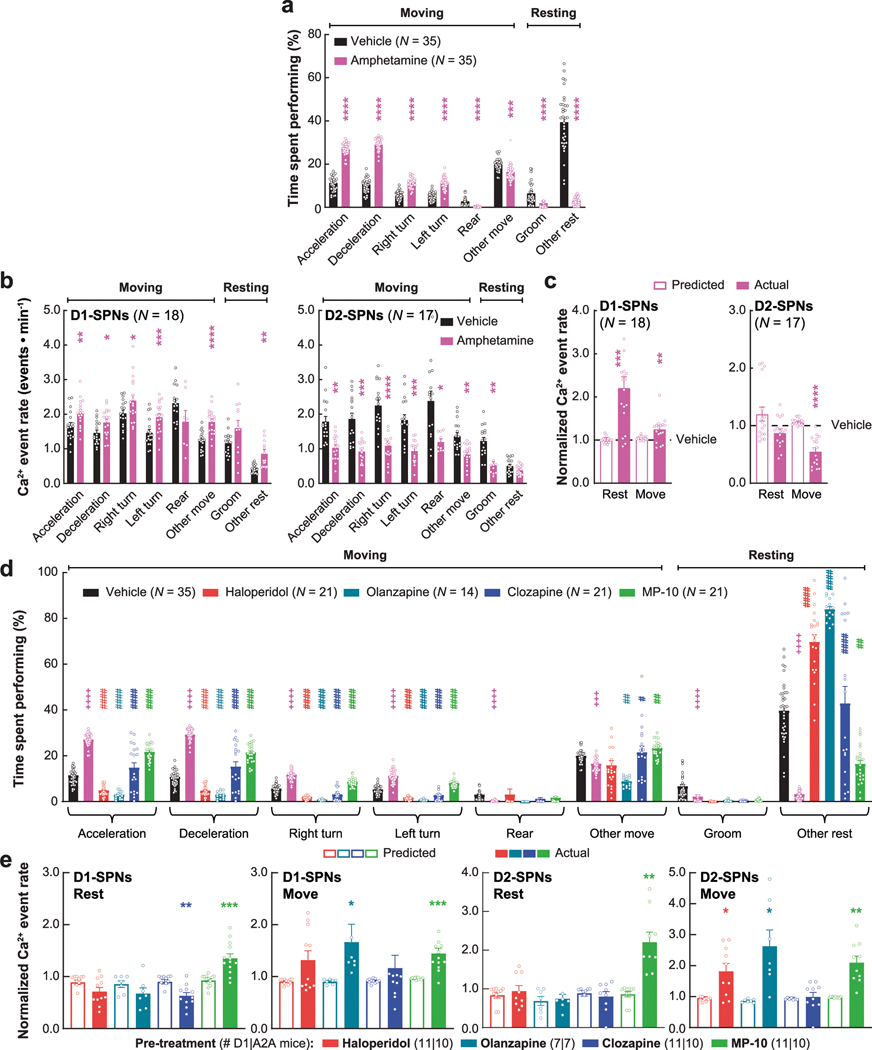
Extended Data Fig. 8 |. Drug effects on the time spent engaged in specific behaviors and their associated D1- and D2-SPN activity levels.
a, b, Proportion of time engaged in specific behaviors (a) and the D1- and D2-SPN Ca2+ event rates associated with those behaviors (b) following vehicle or amphetamine treatment. c, The predicted and actually observed Ca2+ event rates of D1- and D2-SPNs following amphetamine treatment during periods of rest or movement, normalized to values following vehicle treatment. Predicted values were computed from a weighted average of the event rates associated with each behavior following vehicle treatment in (b) and the proportion of time spent engaged in each behavior following amphetamine treatment in (a), where the specific behaviors were grouped into resting and moving types for comparison to the observed data here and reported in the main text (Figs. 1 and 2). d, Proportion of time spent in categorized resting and moving behaviors following vehicle, vehicle + amphetamine, or drug + amphetamine treatment. e, The predicted and actually observed Ca2+ event rates of D1- and D2-SPNs following drug + amphetamine treatment during periods of rest or movement, normalized to values following vehicle treatment. Predicted values were computed from the data in (b) and (d) as described in (c). All data are expressed as mean ± s.e.m. (****P < 10−4, ***P < 10−3, **P < 10−2 and *P < 0.05 compared to vehicle treatment (a, b) or predicted values (c, e); two-tailed Wilcoxon signed-rank test; ++++P < 10−4 and +++P < 10−3 comparing vehicle to vehicle + amphetamine treatment and ####P < 10−4, ###P < 10−3, ##P < 10−2 and #P < 0.05 comparing drug + amphetamine to vehicle + amphetamine treatment (d); One-way ANOVA with Holm-Sidak’s multiple comparison test).

