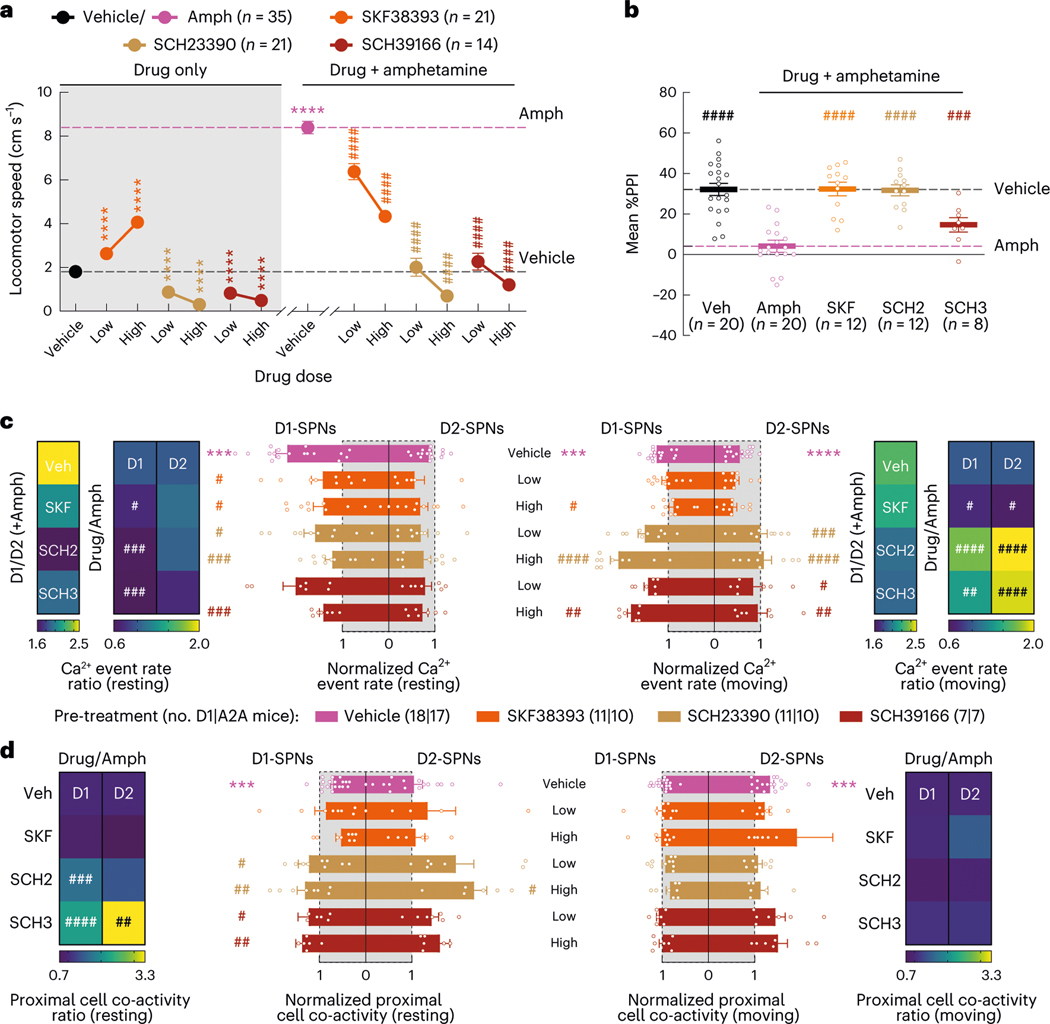
Fig. 5 |. Effects of D1R-targeted compounds on behavior and D1-SPN/D2S-PN dynamics.
a, Mean ± s.e.m. locomotor speed during the 15-min recording period after vehicle or drug treatment and the 45-min recording period after amphetamine treatment (****P < 10−4 for comparison to vehicle treatment; ####P < 10−4 compared to vehicle + amphetamine treatment; one-way ANOVA with Holm–Sidak’s multiple comparison test). b, Mean ± s.e.m. percent PPI, averaged across all pre-pulse intensities after vehicle or high dose of drug + amphetamine treatment (####P < 10−4 and ###P < 10−3 compared to vehicle + amphetamine treatment; one-way ANOVA with Holm–Sidak’s multiple comparison test). c, Mean ± s.e.m. D1-SPN and D2-SPN Ca2+ event rates after vehicle or low/high dose of drug + amphetamine treatment, normalized to values after vehicle-only treatment during periods of rest (left) and movement (right). Heat maps depict the ratio of D1-SPN/D2-SPN activity (D1/D2), normalized to the ratio after vehicle-only treatment, or the vehicle-normalized D1-SPN or D2-SPN event rate after vehicle or high dose of drug + amphetamine treatment, normalized to the corresponding value after vehicle + amphetamine treatment (Drug/Amph). d, Mean ± s.e.m. proximal co-activity of D1-SPNs and D2-SPNs after vehicle or low/high dose of drug + amphetamine treatment, normalized to values after vehicle-only treatment during periods of rest (left) and movement (right). Heat maps depict the vehicle-normalized D1-SPN or D2-SPN proximal co-activity after vehicle or high dose of drug + amphetamine treatment, normalized to the corresponding value after vehicle + amphetamine treatment (***P < 10−3 compared to vehicle treatment; ####P < 10−4, ###P < 10−3, ##P < 10−2 and #P < 0.05 compared to vehicle + amphetamine treatment; one-way ANOVA with Holm–Sidak’s multiple comparison test).

