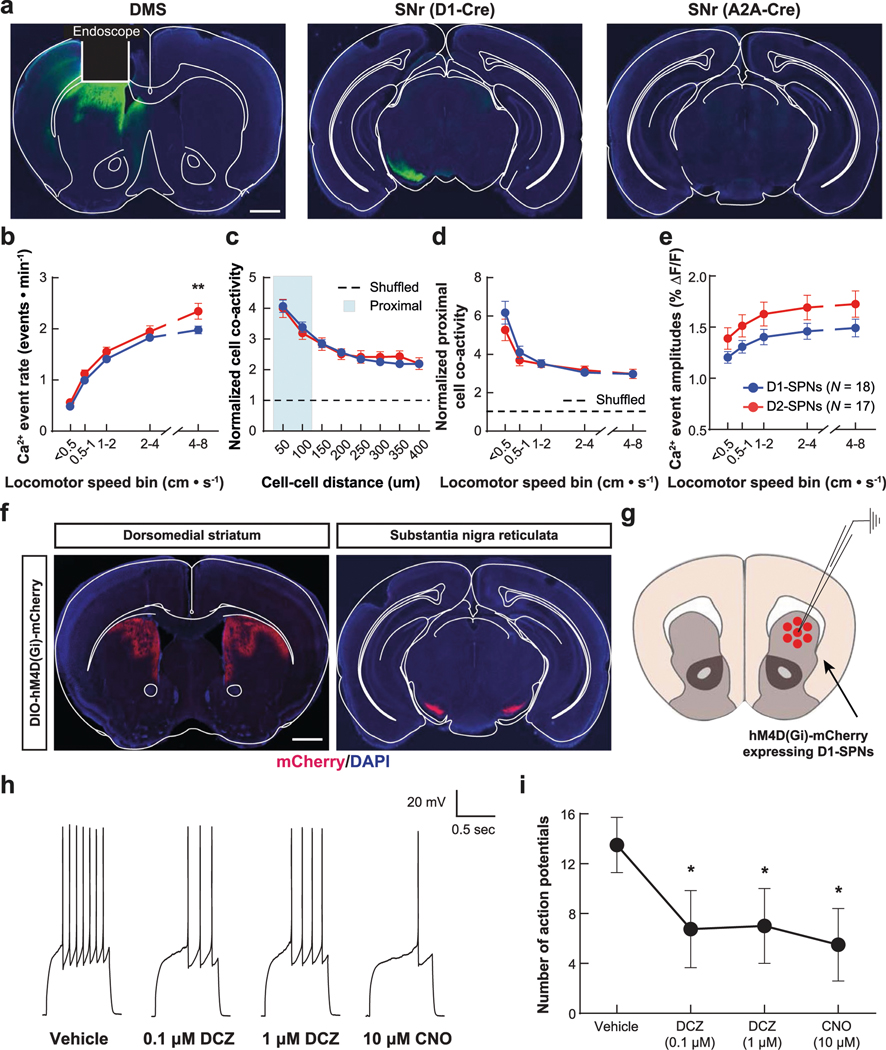
Extended Data Fig. 1 |. Histological validation and characterization of normal D1-/D2-SPN ensemble dynamics and hM4Di-mCherry functionality.
a, Representative coronal brain sections of DMS and substantia nigra reticulata (SNr) from GCaMP7f-expressing D1- or A2A-Cre mice (green: anti-GFP; blue: DAPI nuclear stain; scale bar: 1 mm). White lines indicate the position of the implanted microendoscope and boundaries of brain areas. b, Ca2+ event rates in D1- and D2-SPNs across increasing running speed bins. c, Co-activity ( Jaccard index) of D1- or D2-SPN pairs during movement (locomotor speed >= 0.5 cm·s−1) versus the separation of cell pairs, normalized to temporally shuffled datasets (dashed line). Cyan shading indicates proximal (25–125 μm) cell pairs. d, Co-activity of proximal D1- and D2-SPN pairs across increasing running speed bins, normalized to temporally shuffled comparisons (dashed line). e, Ca2+ event amplitudes in D1- and D2-SPNs across increasing locomotor speed bins (for b–e, N = 18 D1-Cre and N = 17 A2A-Cre mice; data were averaged across all recordings following vehicle only treatment; **P < 0.01 comparing D1-SPNs to D2-SPNs; Two-way ANOVA with Holm-Sidak’s multiple comparison test). f, Representative coronal brain sections of DMS and subtantia nigra from hM4Di-mCherry expressing D1-Cre mice (red: mCherry; blue: DAPI nuclear stain; scale bar: 1 mm). g, We performed patch-clamp electrophysiological recordings from hM4Di-mCherry-expressing neurons in the DMS of D1-Cre mice. h, Representative traces of action potential responses to 250 pA current injection. i, Number of evoked action potentials following vehicle, DCZ or CNO treatment (N = 4 cells; *P < 0.05 compared to vehicle treatment; One-way ANOVA with Holm-Sidak’s multiple comparison test). All data are mean ± s.e.m. Exact P values for these and all other analyses are in the Supplementary Table. All N values refer to number of mice for all figures unless otherwise specified.

