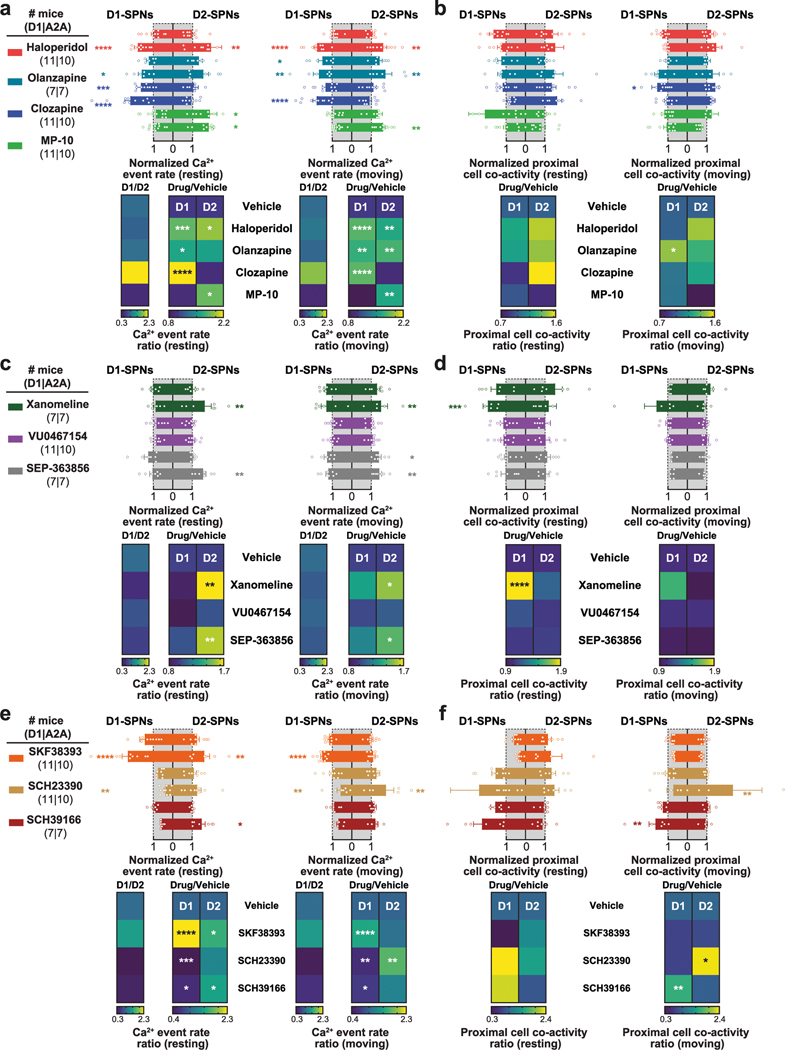
Extended Data Fig. 3 |. Effects of drug treatments on D1-/ D2-SPN dynamics under baseline conditions.
a–f, Bar plots depict the mean ± s.e.m Ca2+ event rates (a, c, e) and proximal co-activity (b, d, f) of D1- and D2-SPNs, normalized to values following vehicle only treatment during periods of rest (left) or movement (right) following haloperidol, olanzapine, clozapine, or MP-10 (a, b), xanome line, VU0467154, or SEP-363856 (c, d), and SKF39393, SCH23390, or SCH39166 (e, f) treatment. Heat maps display either the effects of drugs on the ratio of D1- to D2-SPN Ca2+ event rates (D1/D2; left in a, c, e) or the ratio of drug to vehicle treatment on the rates (Drug/Vehicle; right in a, c, e) or proximal co-activity (b, d, f) of D1- and D2-SPN activity during periods or rest (left) or movement (right) (****P < 10−4, ***P < 10−3, **P < 10−2 and *P < 0.05 compared to vehicle treatment; One-way ANOVA with Holm-Sidak’s multiple comparison test).

