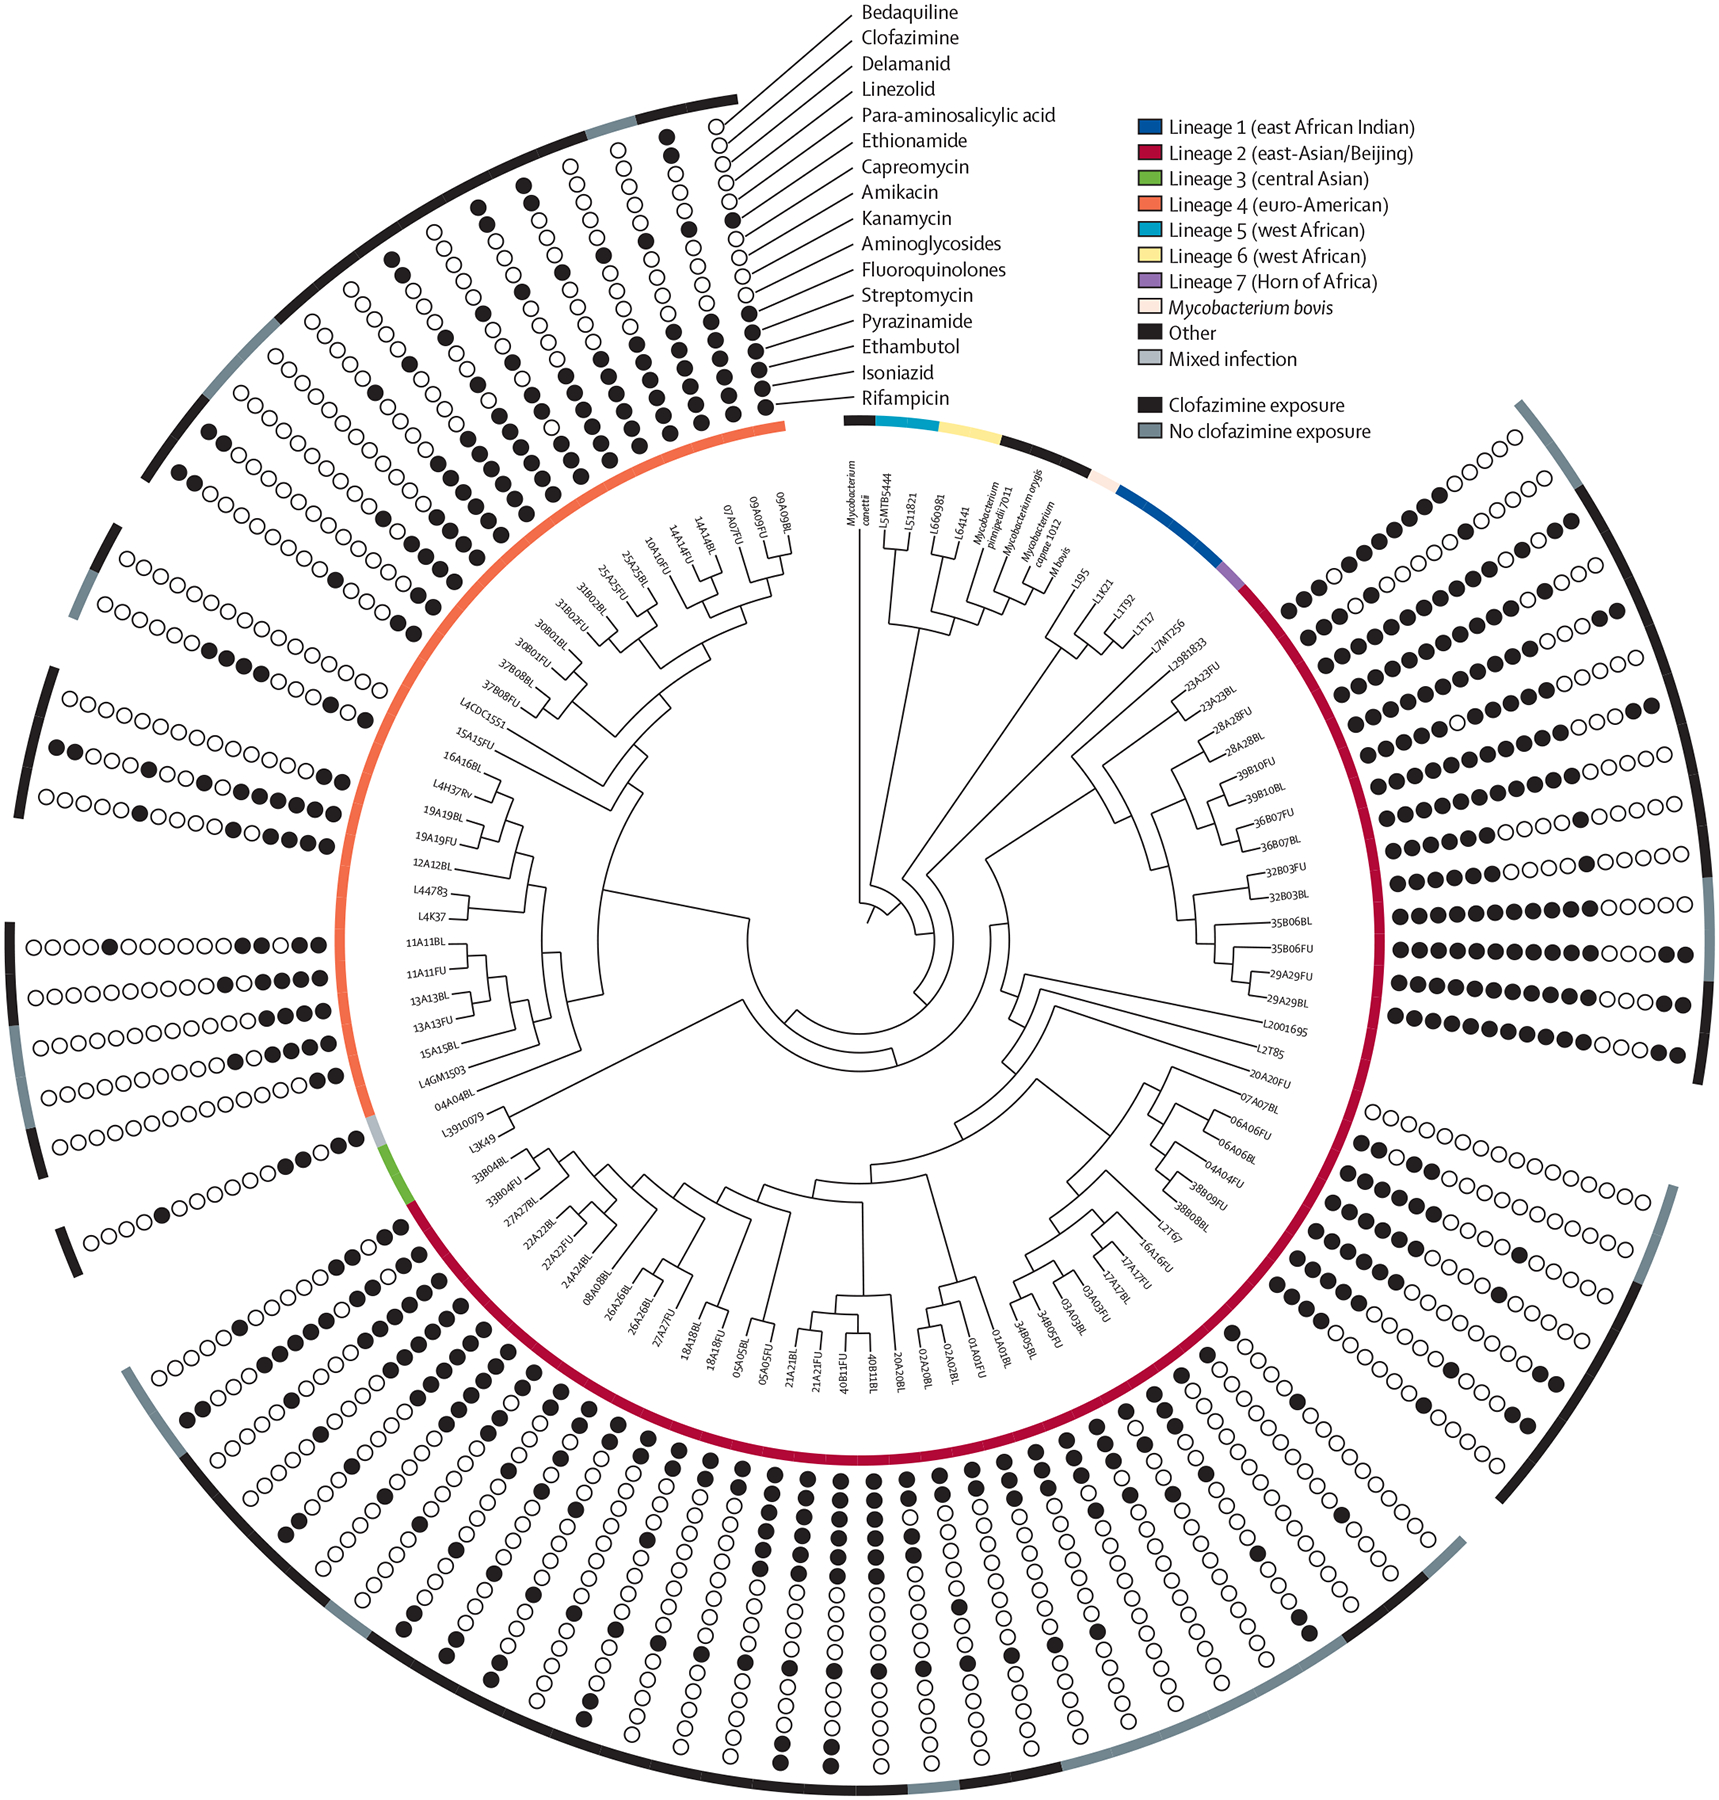
Figure 4: Cladogram showing isolate’s lineage diversity, likely reinfection, drug susceptibility, and clofazimine exposure.

The inner ring shows the cladogram. The outer ring shows clofazimine exposure. The circles show drug susceptibility based on whole-genome sequencing excluding phenotypic drug susceptibility testing for bedaquiline. 51 (67%) of 76 isolates were in L2 (red) and 24 (32%) were in L4 (orange; one mixed with both lineages present at baseline), and isolates were resistant to many drugs. Branch lengths were ignored for visualisation and the phylogenetic analysis included 25 sequences representative of the Mycobacterium tuberculosis complex (appendix 2). BL=baseline. FU=follow-up. L=lineage.
