
Figure 14.
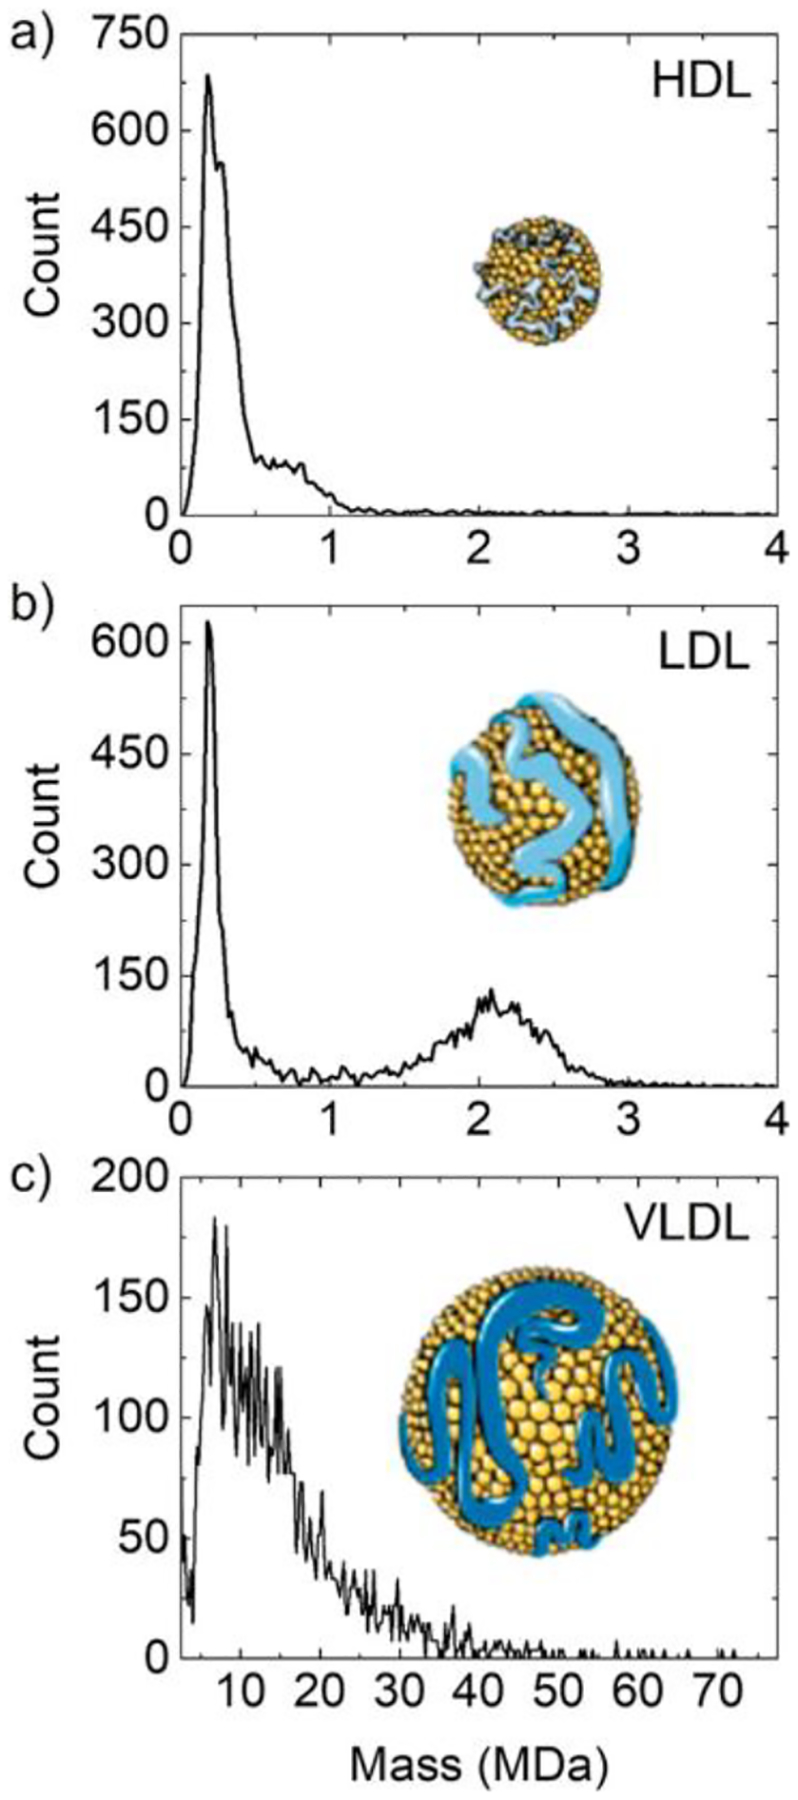
CDMS mass spectra measured for lipoproteins. (a) Mass distribution measured for HDL. (b) Mass distribution for LDL. The peak in the LDL spectrum at 230 kDa is probably an HDL impurity. (c) Mass distribution measured for VLDL. The insets show structures of the lipoprotein particles. Adapted with permission from ref 268. Copyright 2018 American Chemical Society.