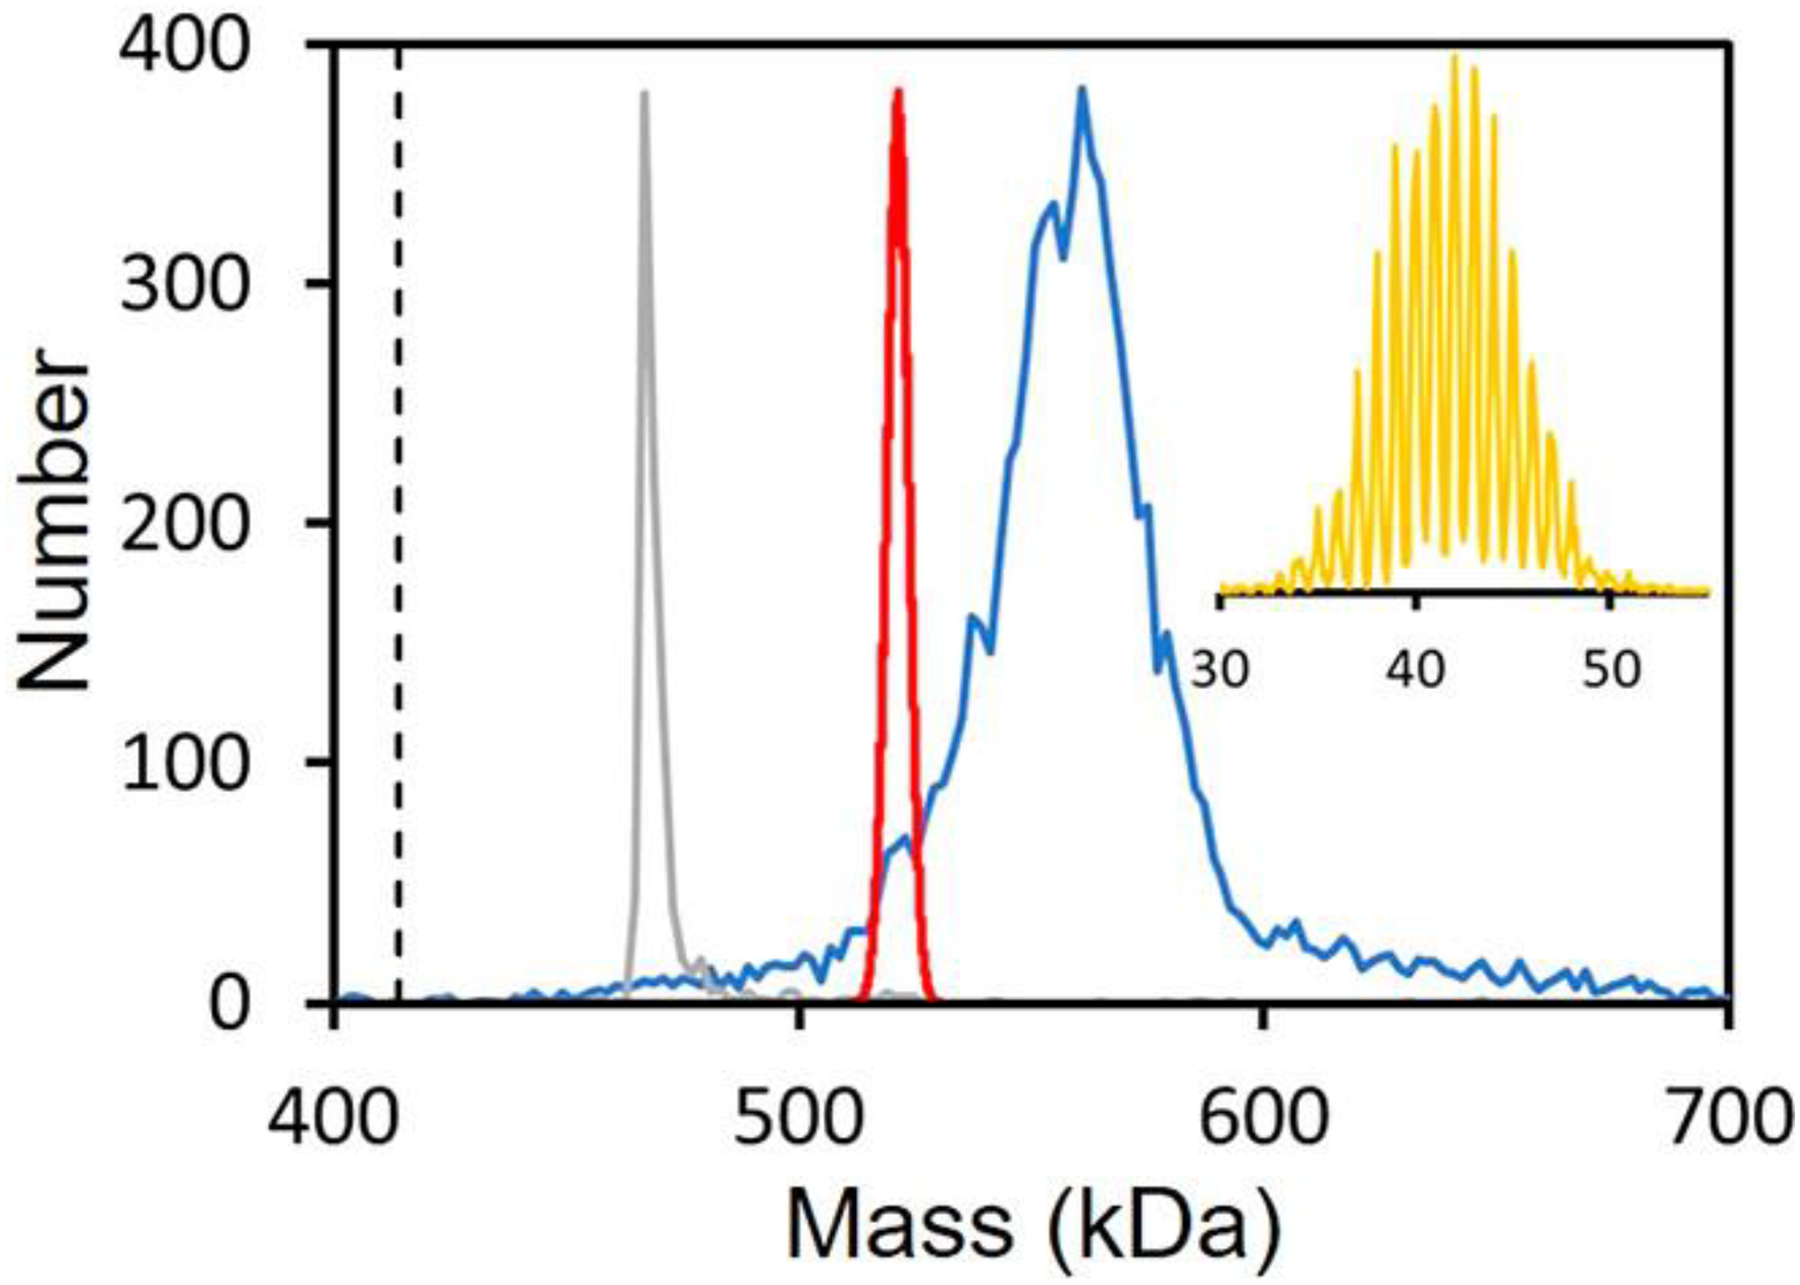
Figure 5.

CDMS spectrum measured for the heavily glycosylated SARS-CoV-2 S protein trimer (blue line). The gray line shows the mass distribution measured for β-galactosidase under identical conditions. The dashed vertical line shows the sequence mass of the unglycosylated trimer (414.2 kDa). The red line shows the mass distribution predicted for a statistical distribution using the glycan populations determined from glycoproteomic measurements (see text). The orange inset shows the measured charge distribution, which shows good resolution of the charge states (RMSD = 0.191 e). Adapted with permission from ref 133. Copyright 2021 American Chemical Society.
