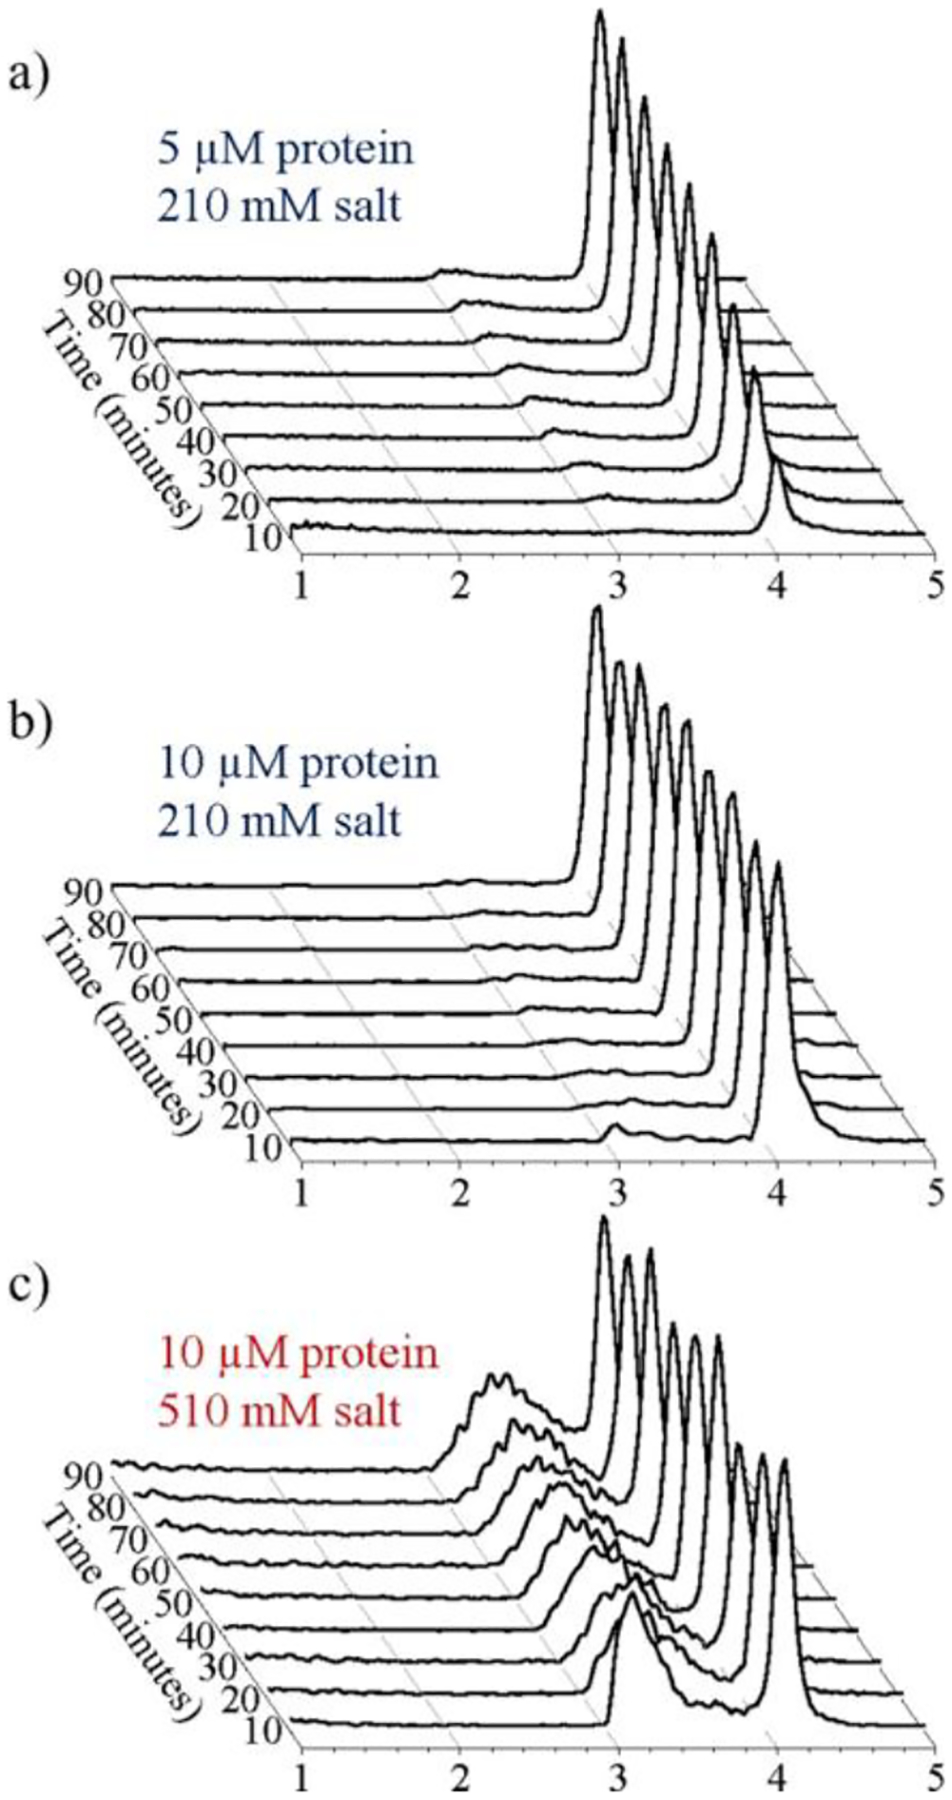
Figure 7.

Time-resolved CDMS spectra showing the progression of HBV capsid assembly over the first 90 min: (a) for a reaction mixture containing an initial dimer concentration of 5 μM in 210 mM ammonium acetate; (b) for a 10 μM dimer in 210 mM ammonium acetate; and (c) for a 10 μM dimer in 510 mM ammonium acetate. The earliest time interval (0–10 min) is at the front. The spectra were generated using 20 kDa bins. Each spectrum is normalized by the sum of all ions measured for each time point. Adapted with permission from ref 159. Copyright 2017 American Chemical Society.
