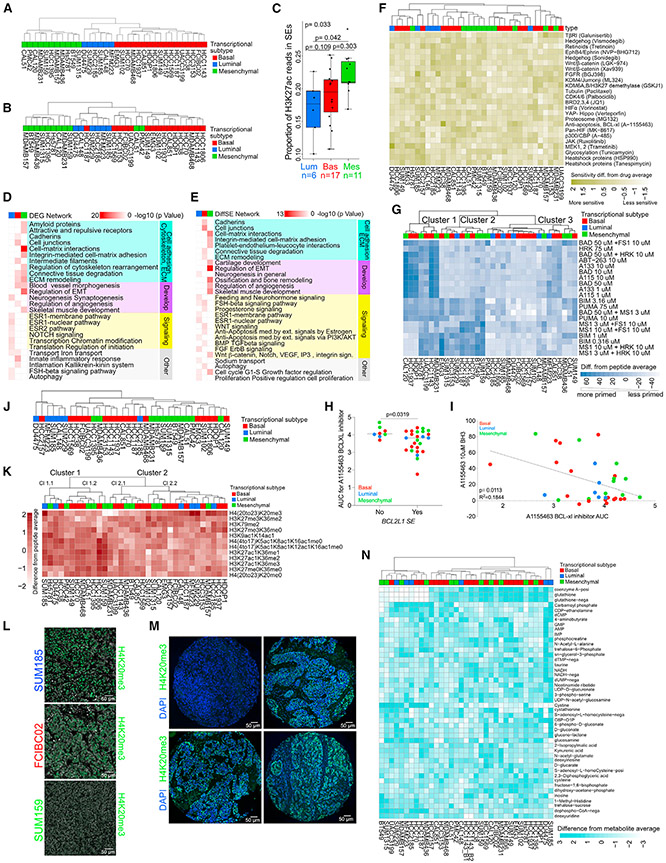
Figure 1. Comprehensive molecular profiles of TNBC.
(A) Dendrogram depicting clustering of 34 TNBC cell lines based on the expression of the top 20% most variable genes. Subtype identifiers were assigned based on genes differentially expressed between the three major clusters. See also Table S1.
(B) Dendrogram depicting clustering of 33 TNBC cell lines based on H3K27ac signal in the top 20% most variable SEs.
(C) Boxplots showing the proportion of H3K27ac reads in SEs for cell lines in each TNBC subtype. Overall p value from Kruskal-Wallis test. Pairwise p values from Dunn’s test, adjusted using Holm’s method. Center lines shows medians. Hinges show interquartile ranges. Upper whiskers extend from the upper hinge to the highest value that is no further than 1.5 times the IQR from the hinge. Lower whiskerslate extends from the lower hinge to the lowest value that is nor further than 1.5 times the IQR from the hinge.
(D) Metacore networks enriched in differentially expressed genes (DEGs) among the three TNBC transcriptional subtypes. See also Table S2.
(E) Metacore networks enriched in TNBC transcriptional subtype-specific differential SEs. See also Table S2.
(F) Heatmap demonstrating TNBC cell line sensitivity to SMIs.
(G) Heatmap showing clustering of 34 TNBC cell lines based on the top 50% most variable BH3 peptides. Values shown are abundance differences from peptide average.
(H) Plot depicting sensitivity to the A1155463 BCL-xl inhibitor in TNBC lines where BCL2L1 is an SE or not. Error bars represent mean ± SEM; p value, Mann-Whitney U test.
(I) Plot depicting the correlation between BH3 profiling and drug area under the viability curve for treatment response (AUC) for the A1155463 BCL-xl inhibitor in TNBC cell lines (p = 0.0113, R2 = 0.1844, Pearson correlation).
(J) Dendrogram depicting clustering of 34 TNBC cell lines based on DNA methylation levels in the top 20% most variable SEs.
(K) Heatmap showing clustering of 34 TNBC cell lines based on the top 20% most variable histone marks determined by mass spectrometry. Average difference in mean -normalized H3K27ac, H3K27ac1K36me1, H3K27ac1K36me2, and H3K27ac1K36me3 values from cell line average = 0.032 (luminal), −0.17 (basal), and 0.25 (mesenchymal). Average difference in -normalized H4 (20–23) K20me3 value from cell line average = 1.48 (luminal), −0.063 (basal), −0.71 (mesenchymal).
(L) Immunofluorescence for H4K20me3 in SUM185 (luminal), FCIBC02 (basal), and SUM159 (mesenchymal) cell lines. Scale bars, 50 μm.
(M) Representative histone H4K20me3 immunofluorescence staining of four TNBC patient samples from the tissue microarray (TMA). Scale bars, 50 μm.
(N) Heatmap showing clustering of 34 TNBC cell lines based on the levels of the top 20% most variable metabolites. Values shown are expression differences from metabolite average. Values are capped at ±3 for the purpose of visualization.
See also Figure S1 and Tables S1-S17. Blue, red, and green colors mark luminal, basal, and mesenchymal TNBC transcriptional subtypes in all figures.

