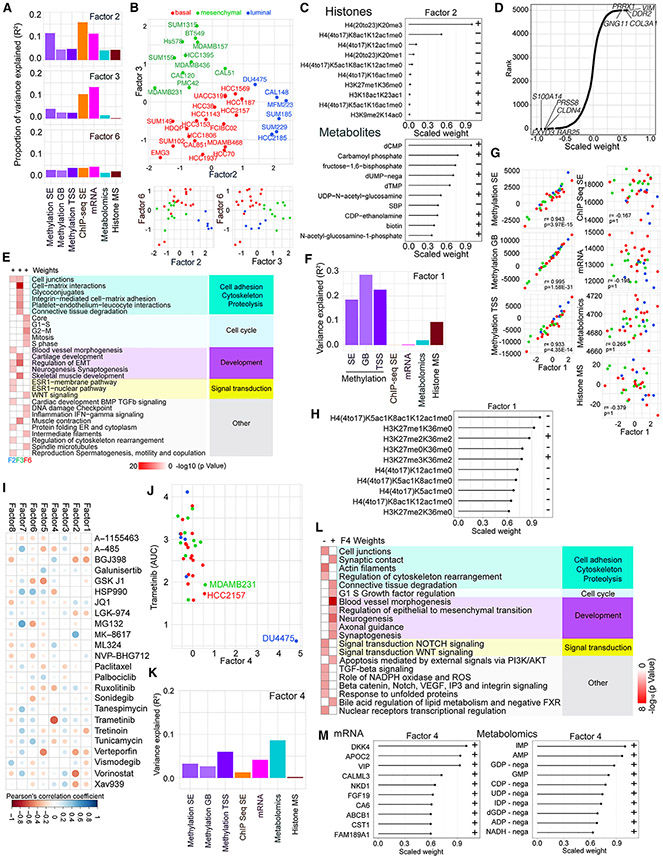
Figure 2. Integrated analysis of the genomics data using multiomics factor analysis (MOFA).
(A) Bar graph of the proportion of variance explained in each dataset by F2, F3, and F6.
(B) Scatterplots depicting F2, F3, and F6 values across TNBC cell lines.
(C) Scaled F2 weights for the histone mark combinations with the largest absolute weights for this factor and scaled F2 weights for the metabolites with the largest absolute weights for this factor. Scaled weights for each factor in each dataset are derived from the weights for that factor in that dataset by linearly rescaling the values to lie between −1 and 1.
(D) Scaled mRNA weights for F3, with the top five negatively and positively weighted features labeled. Scaled weights for each factor in each dataset are derived from the weights for that factor in that dataset by linearly rescaling the values to lie between −1 and 1.
(E) Metacore networks for F2, F3, and F6 positive mRNA weights. See also Table S2.
(F) Bar graph showing the variance explained by F1 within each dataset.
(G) Scatterplots of total signal in each dataset against F1 scores; p values, Holm-adjusted Pearson correlation test.
(H) Scaled F1 weights for the histone mark combinations with the largest absolute weights for this factor. Scaled weights for each factor in each dataset are derived from the weights for that factor in that dataset by linearly rescaling the values to lie between −1 and 1.
(I) Correlations between MOFA F1–F8 and SMI features. Dot colors and sizes represent Pearson’s correlation coefficient values for the indicated pairs of drugs and factors.
(J) Scatterplot showing F4 scores and trametinib AUC across TNBC cell lines.
(K) Bar graph showing variance explained for F4 across each dataset.
(L) Metacore networks for F4 positive and negative mRNA weights. See also Table S2.
(M) Scaled F4 weights for the mRNA and metabolomics features with the largest absolute weights. Scaled weights for each factor in each dataset are derived from the weights for that factor in that dataset by linearly rescaling the values to lie between −1 and 1.

